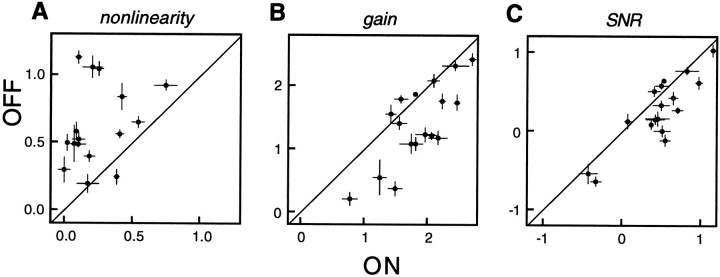
Fig. 11.
Nonlinearity, gain, and SNR asymmetry summary. A, Each point shows the mean nonlinearity index for all L-ON cells and all L-OFF cells recorded in one preparation. Error bars indicate 1 SEM. Nonlinearity index is the logarithm of the ratio of the slope of the nonlinearity at the maximum generator signal value observed to the slope at zero generator signal. Data from 169 L-ON and 162 L-OFF cells from 17 preparations are represented. B, Mean logarithm of response gain for L-ON cells and L-OFF cells. Response gain is the derivative of firing rate (spikes per second) with respect to the contrast of a brief (15 or 8.33 msec) achromatic full-field flash deduced from white noise measurements. C, Mean logarithm of signal-to-noise ratio (SNR) for L-ON and L-OFF cells. SNR is defined as the response gain divided by the SD of spike counts observed at zero generator signal.

