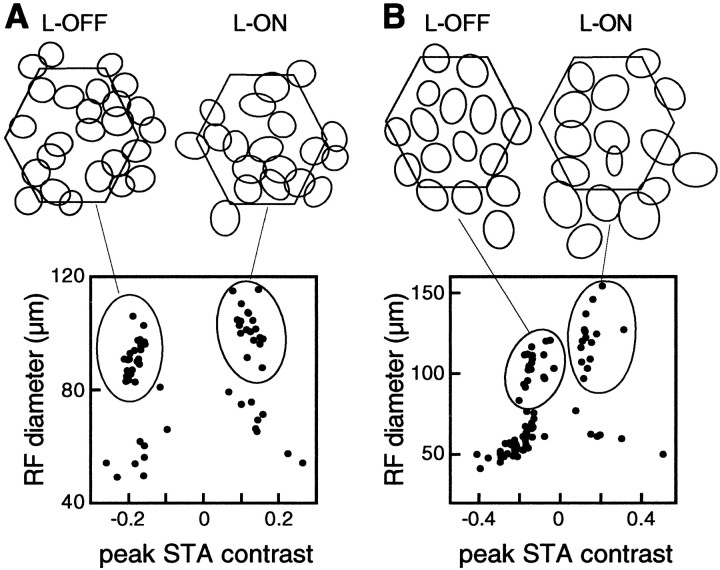
Fig. 3.
Cell classification for two preparations (A, B). A, Scatter plot shows the RF diameter and peak STA contrast for each of 62 cells recorded simultaneously. Clusters defining L-ON cells (right) and L-OFF cells (left) are indicated by ovals. Top panel shows outlines of RFs (1 SD boundary of Gaussian fit; see Materials and Methods) for all L-OFF cells and L-ON cells in this preparation.B, Data from 85 cells recorded in a second preparation, in the same format as A.

