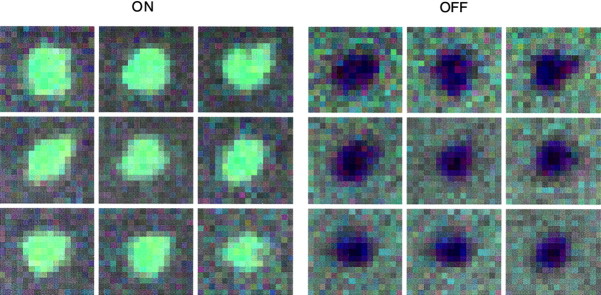
Fig. 6.
Receptive field size asymmetry. For nine L-ON (left) and nine L-OFF (right) cells recorded simultaneously, the average stimulus on the display 45 msec (3 frames, near time-to-peak) before a spike is shown in the same format as Figure 1. Cells of each group are sorted by RF size, from largest (top left) to smallest (bottom right). The RF location of each cell is different; these images have been cropped to the region immediately surrounding the RF.

