
Fig. 2.
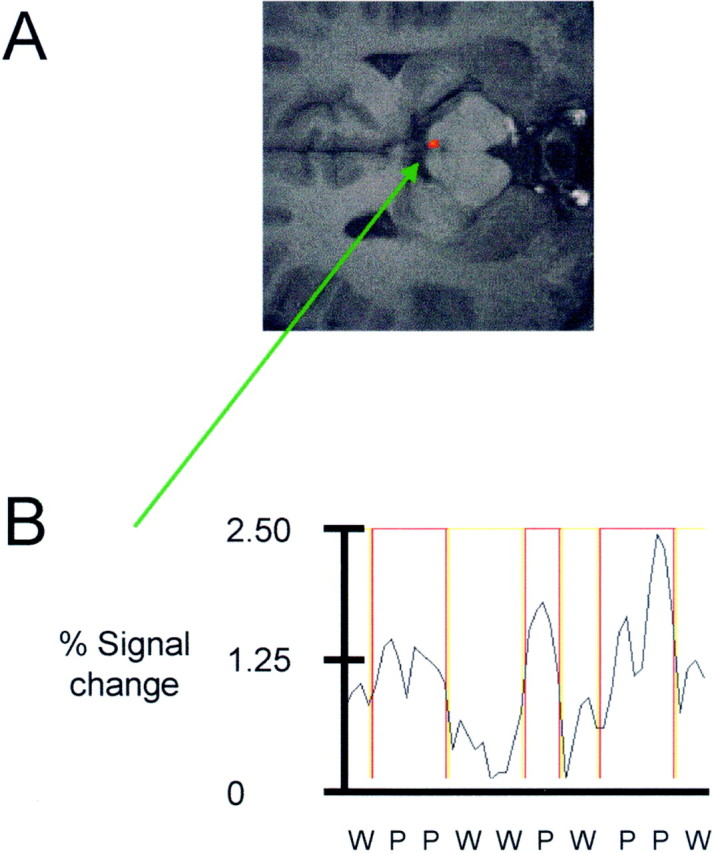
A, B, Figure showing representative activation within the periaqueductal gray for one subject (A). The corresponding time course of MR signal intensity change during warm (yellow boxes) and painful (red boxes) stimulation for the voxel with highest Z statistic is also shown (B).