
Fig. 4.
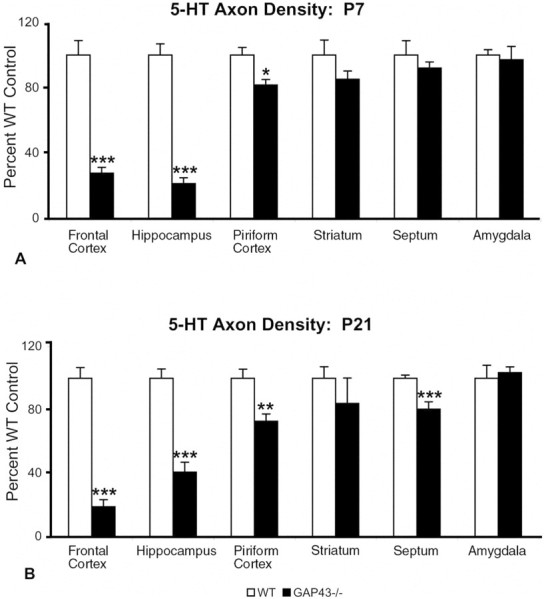
5-HT axon densitometric analysis at P7 (A) and P21 (B) shows deficits in some but not all forebrain regions. Values are expressed as a percentage of the WT control mean. The density of 5-HT axons in the frontal cortex, hippocampus, and piriform cortex of GAP43−/− mice (black bars) is significantly reduced compared with WT mice (white bars) at both ages examined. In contrast, subcortical regions such as the amygdala and striatum show no significant differences in 5-HT innervation densities at both ages. 5-HT axon density in the septum is significantly reduced compared with WT at P21 but not at P7. *p ≤ 0.05; **p ≤ 0.01; ***p ≤ 0.001.