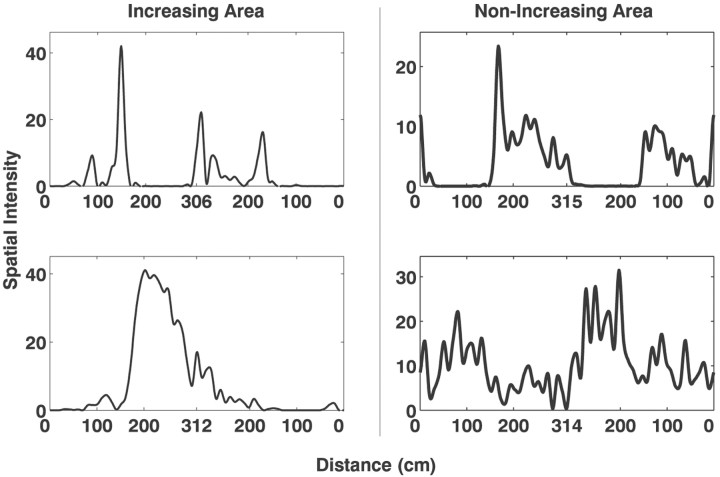
Fig. 10.
Examples of instantaneous receptive fields from deep EC neurons with increasing (left column) and non-increasing (right column) spatial intensity function areas. Each plot represents the spatial intensity function of a single deep EC neuron. On average, the neurons with increasing spatial intensity functions had more restricted spatial receptive fields than neurons with non-increasing spatial intensity functions.

