Fig. 2.
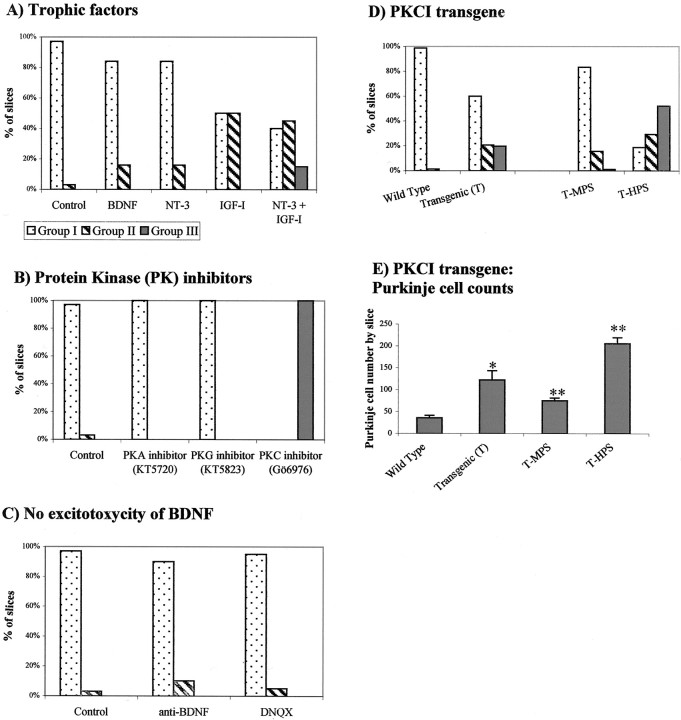
Quantitative analysis of Purkinje cell survival after trophic factors and protein kinase inhibitor treatment. Histograms illustrate the percentages of P3 cerebellar slices maintained at 5 DIV belonging to groups I–III (as described in Materials and Methods and in Fig. 1) after different treatments.A, The slice cultures were not treated (Control) or treated separately with BDNF, NT-3, IGF-I, or NT-3 plus IGF-I. The survival of Purkinje cells was always low. Indeed, most of the slices were in group I (without groups of >20 Purkinje cells), and few slices belonging to group III (15%, with at least 1 cluster of >50 Purkinje cells) were obtained only when NT-3 was combined with IGF-I. B, Slices treated with KT5720 (PKA inhibitor), KT5823 (PKG inhibitor), or Gö6976 (PKC inhibitor). Note that only the PKC inhibitor (Gö6976, 2 μm) permitted survival of the majority of these cells; all slices belonged to group III. C, Slices treated with an antibody against BDNF or DNQX (the non-NMDA glutamate receptor antagonist). Note that the majority of the slices exhibited a very low survival rate of Purkinje cells, belonging to group I. D, The survival, after 5 DIV, of Purkinje cells was higher in P3 organotypic cerebellar cultures taken from L7-PKCI transgenic mice, in which the pseudosubstrate PKC inhibitor was selectively expressed in Purkinje cells than in those taken from wild-type mice. In transgenic animals (T), we distinguished two obvious subgroups of mice: the ones characterized by a medium Purkinje cell survival (T-MPS) and the other one with high Purkinje cell survival (T-HPS). E, Histograms illustrating the number of Purkinje cells per slices in organotypic cerebellar cultures taken from wild-type mice, transgenic (T) mice, T-MPS mice, andT-HPS mice. Each bar indicates mean ± SEM. *p < 0.01 between T andWild Type; **p < 0.01 betweenT-MPS and Wild Type andT-HPS and Wild Type.

