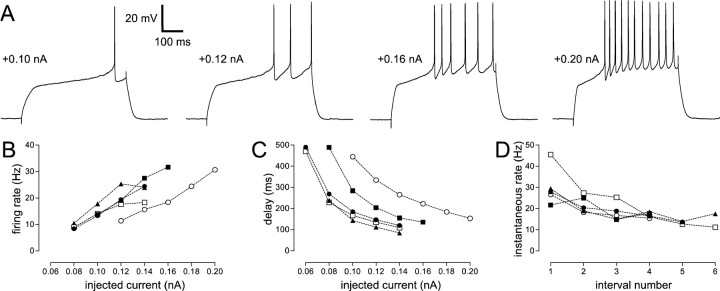
Fig. 3.
Firing properties of the SN cell type.A, Sample traces of an SN firing in response to four successively larger 500 msec current pulses. The baseline potential was −84 mV. B, Firing rate plotted as a function of injected current for five representative SNs. The firing rate was defined as the inverse of the average interspike interval, so that the delay before the first spike is excluded from this calculation. Each symbol corresponds to a different neuron, and a given symbol represents the same neuron inB–D (e.g., the filled circles signify the same cell in all panels). C, Delay from the onset of the current pulse to the time of the first spike for the same five SNs, plotted as a function of current amplitude.D, Spike rate accommodation for these SNs, illustrated by plotting the instantaneous firing rate (inverse of the interspike interval) for each interval during a current pulse that evoked a mean firing rate of ∼20 Hz. Current pulse amplitude for each neuron:filled circle, 0.12 nA; filled square, 0.12 nA; filled triangle, 0.10 nA; open circle, 0.16 nA; open square, 0.14 nA. Eachpoint in these graphs represents the average of two repetitions of the same current amplitude. All current pulses were 500 msec in duration. The sample traces shown in A were taken from the neuron denoted by open circles inB–D. The cells denoted by filled circlesand open squares were recorded in canary brain slices; the others are from zebra finches.

