
Fig. 10.
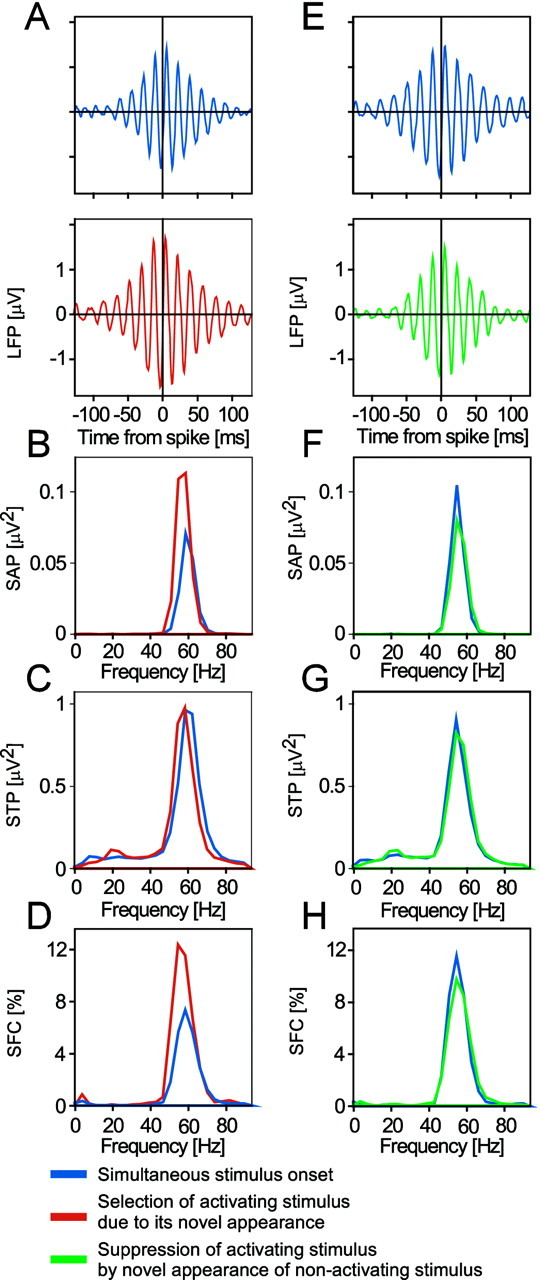
A–D show an example of enhanced oscillatory synchronization caused by the selection of a newly appearing activating stimulus. A shows STAs,B the power spectra of these STAs, C the STPs (i.e., the average power spectra of all the LFP segments included in the computation of the respective STA), and D the SFCs (i.e., the power spectra of the STAs normalized by the respective STPs and multiplied by 100). In A–D, the blue graph was computed from data recorded during the first 1.5 sec after the simultaneous onset of the stimulus activating the recorded neurons and the competing nonactivating stimulus. The respective red graph is from data recorded during the first 1.5 sec after onset of the activating stimulus, whereas the competing nonactivating stimulus in the other eye is already on for 3 sec, thus endowing the activating stimulus with a competitive advantage. As shown by both the power of STA and the SFC, the selection of a newly appearing activating stimulus leads to enhanced oscillatory synchronization. E–H show an example of reduced oscillatory synchronization caused by suppression of the activating stimulus by a newly appearing nonactivating stimulus. InE–H, the data are from between 3 and 4.5 sec after onset of the activating stimulus. Data shown as blue graphs are from the condition in which stimuli were presented simultaneously to both eyes, whereas green graphs refer to the condition in which the competing nonactivating stimulus had just been switched on and led to suppression of the activating stimulus. Data shown in this figure are the same as those used in Figures6A–D, 7A–D, and 8.