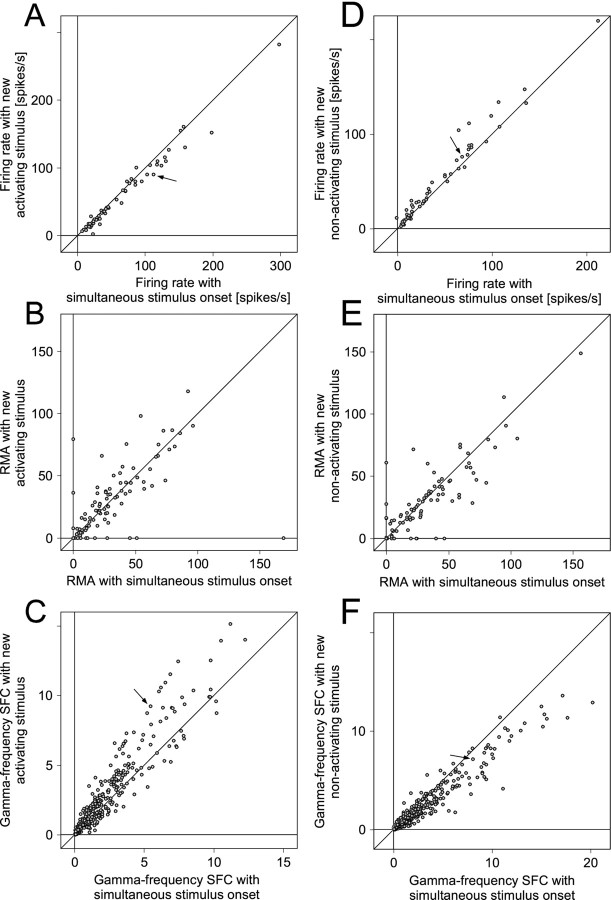
Fig. 11.
A–C show the statistics of MUA firing rates (A), MUA correlation (B), and gamma-frequency SFC (C) for neuronal responses driven by a stimulus selected because of its novel onset. In all panels, xvalues refer to the condition with simultaneous onset of both stimuli, whereas y values represent the condition in which the activating stimulus appears with delay and, thus, has the competitive advantage resulting from novelty. The arrows inA and C correspond to the recordings illustrated as an example in Figures 6, B andC, and 10A–D.D–Fshow the same statistics as A–C for neuronal responses driven by a stimulus suppressed because of the new appearance of the nonactivating stimulus. The y values represent the condition in which the nonactivating stimulus appears with delay and, thus, leads to perceptual suppression of the activating stimulus. Thearrows in D and Fcorrespond to the recordings illustrated as an example in Figures 6,B and D, and 10, E andF.

