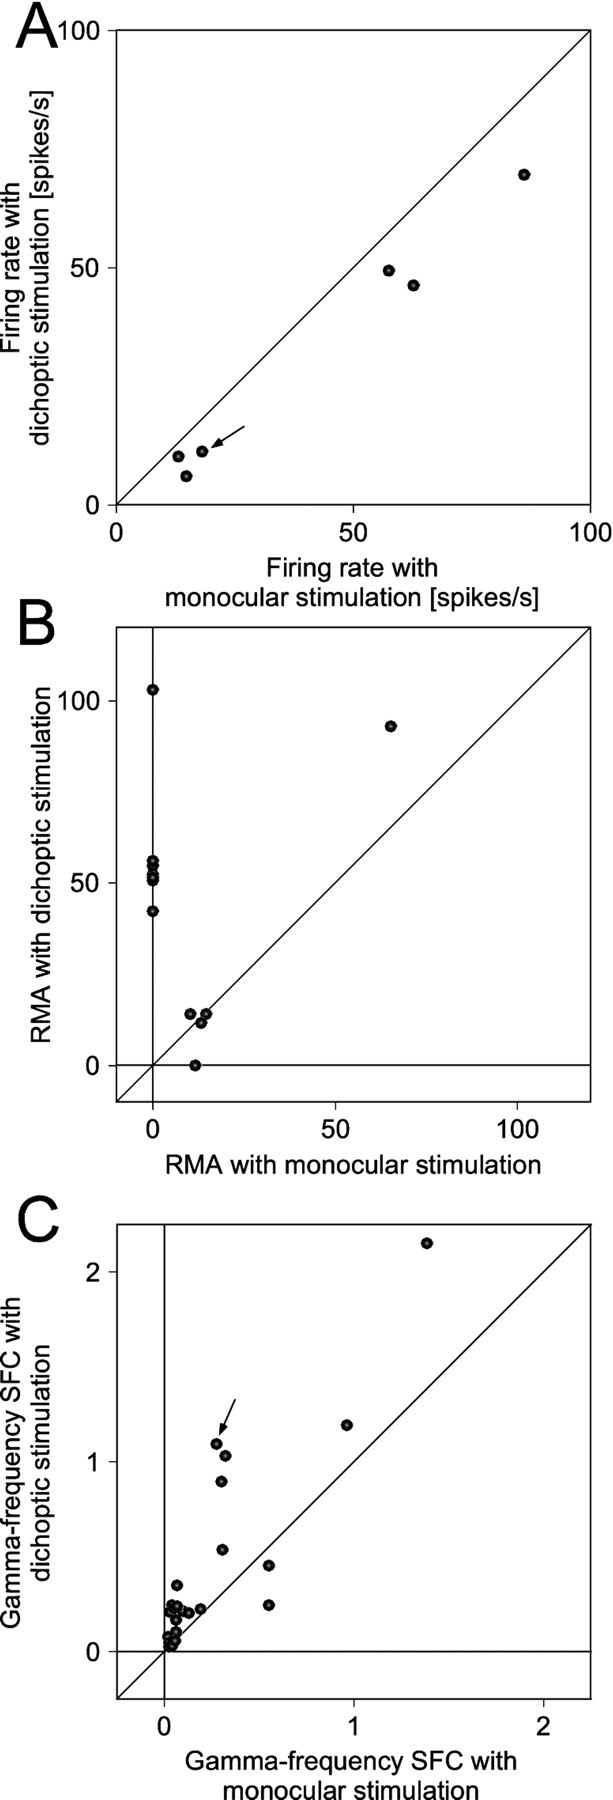
Fig. 13.

Statistics of MUA firing rates (A), MUA correlation (B), and gamma-frequency SFC (C) for neuronal activity driven by a stimulus selected because of its high contrast. The same conventions as in Figure 9, except that responses are from neurons driven by the nondominant eye and, moreover, that the nondominant eye is presented with a high- and the dominant eye with a low-contrast stimulus, respectively. The arrows in Aand C correspond to the recording illustrated in Figure12.
