
Fig. 14.
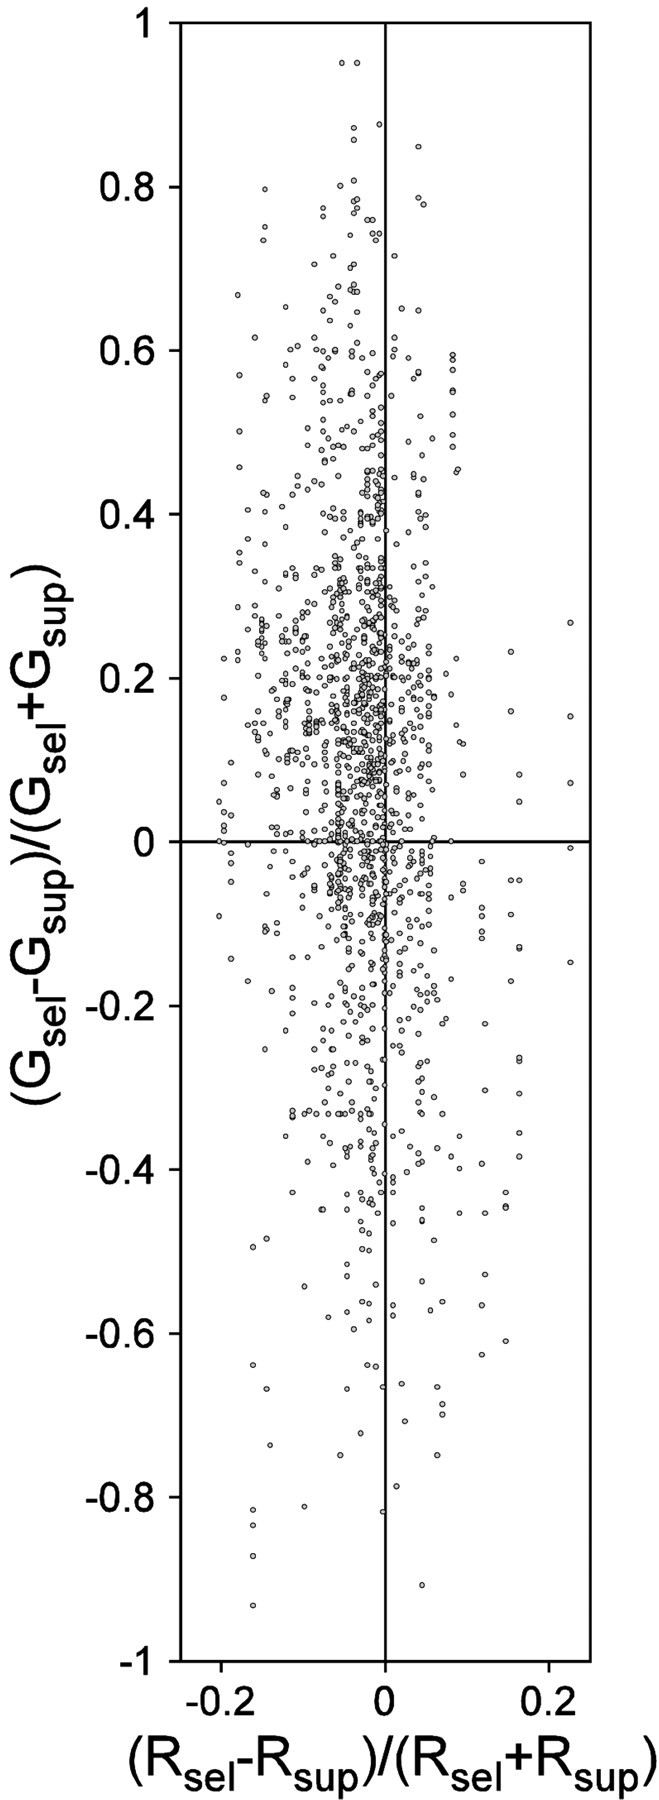
The relation between changes in gamma-frequency SFC and firing rate during stimulus selection. The scatter plot compares stimulus selection effects on firing rates (x-axis) and on gamma frequency SFC (y-axis). Each dot represents one pair of recording sites. x- and y-axis values are selection indices defined asSI(P) = (Psel −Psup)/(Psel+ Psup), with P being the parameter firing rate (R) or gamma-frequency SFC (G) and the subscript specifying whether the activated stimulus is selected or suppressed. There was a small and significant negative correlation between firing rate and SFC indices (Spearman rank correlation: ρ = −0.145; p< 0.0001).