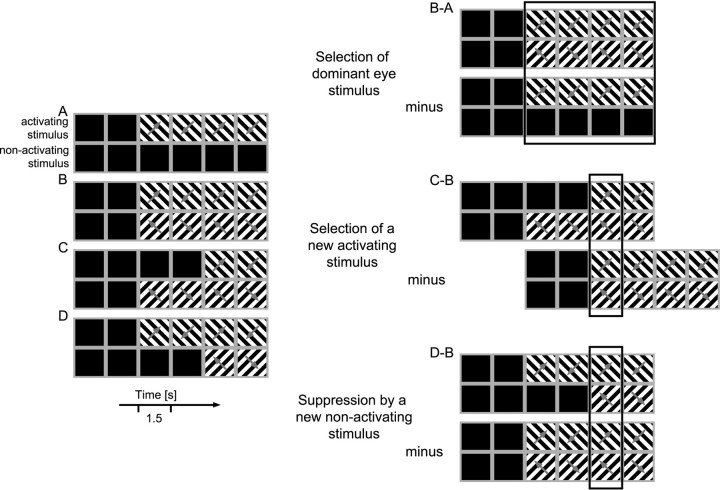
Fig. 2.
Visual stimulation conditions. Eachrow of rectangles illustrates stimulation of one eye as a function of time shown on the x-axis.Black rectangles stand for 1.5 sec periods of presentation of a blank screen, whereas the striped rectangles illustrate 1.5 sec periods of presentation of a moving grating with the movement direction indicated by thearrow. A, Monocular stimulation of the activating eye. B, Dichoptic concurrent stimulation.C, Dichoptic stimulation with a temporal offset between the presentation of the activating and the nonactivating stimulus.D, Dichoptic stimulation with a temporal offset but reverse order of the activating and the nonactivating stimulus.B-A, To demonstrate the effect of eye dominance-driven stimulus selection, neuronal activities from stimulation conditionsA and B are compared for the time periods indicated by the black outline. C-B, To reveal the effect of the selection of a newly appearing activating stimulus, conditions C and B are compared. D-B, Comparison performed to isolate the effect of the suppression by a newly appearing nonactivating stimulus. To this end, conditions D and B are compared.

