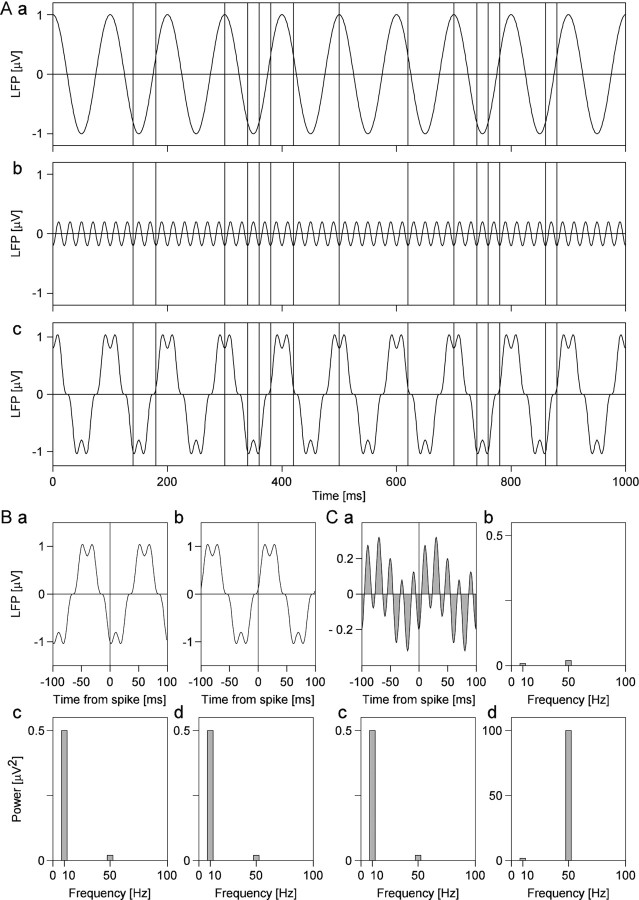
Fig. 4.
Computation of spike-field coherence.A shows two oscillatory processes (a,b) that are superimposed (c) to simulate LFP fluctuations. The high-amplitude componenta oscillates at 10 Hz, and the low-amplitude componentb oscillates at 50 Hz. Vertical lines in the three plots a–c indicate the occurrence of action potentials that are time-locked to the negativities of the 50 Hz oscillations, but not the 10 Hz component, and skip cycles at random.Ba and Bb show two examples of LFP segments extending ±100 msec times around two spikes. The power spectra of these LFP segments are shown in c andd, respectively. The 10 Hz component with the amplitude of 1 μV has a power of 0.5*(1 μV)2 = 0.5 μV2, and the 50 Hz component with the amplitude of 0.2 μV has a power of 0.02 μV2, respectively.Ca shows the STA of the LFP segments (at ±100 msec) for all 19 spikes. Because the spikes are perfectly phase-locked to the 50 Hz component, this component is not attenuated by averaging, whereas the 10 Hz component is strongly reduced. This differential reduction in power can be seen in the power spectrum of the STA (Cb). The power at 50 Hz is 0.02 μV2, just as it had been in the original signal, but the power at 10 Hz is only 0.008 μV2, which is only 1.6% of the original 0.5 μV2. Cc shows the average of the power spectra of all 19 LFP segments used to calculate the STA. Dividing Cb by Cc and multiplying by 100 yields the SFC that is shown in Cd. Note that the SFC is not a power measure but a measure without dimension that assumes the value 100 for perfect phase synchronization (as in the present case for 50 Hz) and the value zero for no phase synchronization. The small but remaining coherence value at 10 Hz is caused by the low number of spikes, resulting in insufficient averaging. Note that the SFC reflects the selective synchronization of the spikes to the 50 Hz component and compensates for the higher amplitude of the 10 Hz component (Cc) by normalization.

