
Fig. 6.
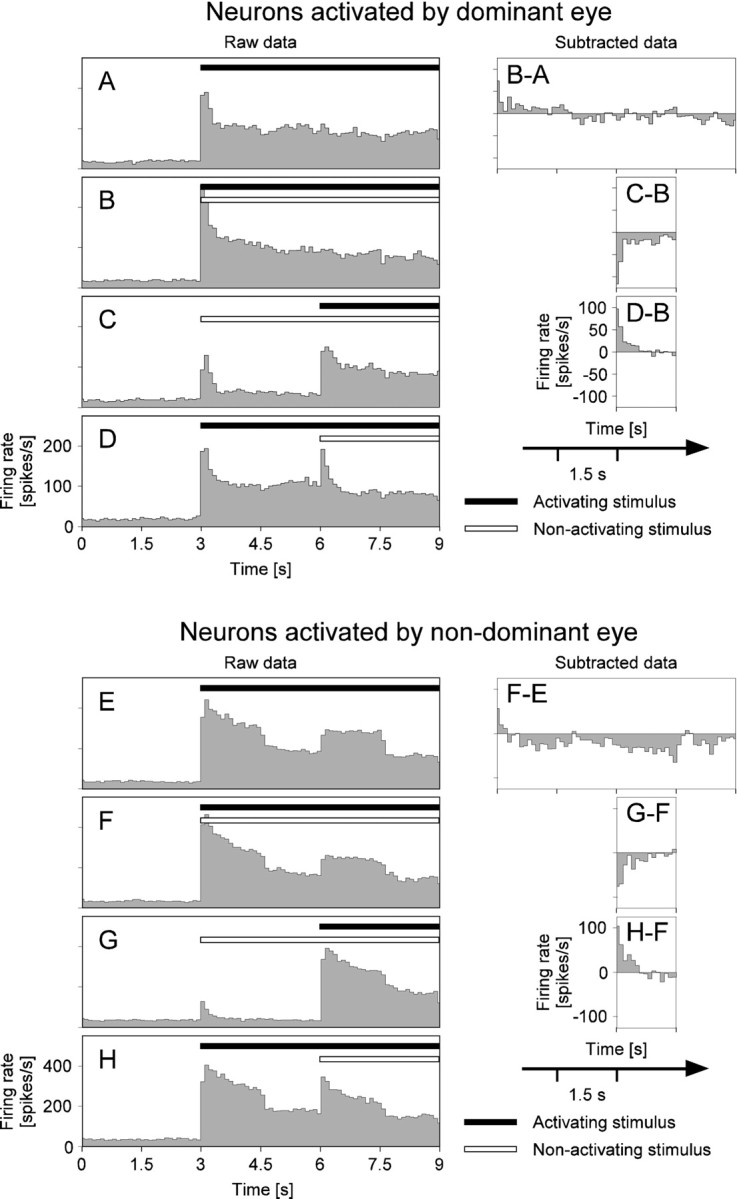
Examples of firing rates under monocular and binocular stimulation conditions. A–D show peristimulus time histograms (PSTHs) for neurons driven by the dominant eye, i.e., changes of the firing rate as a function of time after trial start at bin widths of 100 msec. These are the same data as those used in Figures 7A–D, 8, and 10. Stimulus onset is at 3 sec after trial start. The four PSTHs correspond to the four stimulus paradigms used throughout the study (compare with Fig. 2).A, PSTH for monocular stimulation of the left eye that drives the recorded MUA. B, PSTH for dichoptic stimulation. C, PSTH for delayed dichoptic stimulus presentation, stimulation of the nonactivating eye starting at 3 sec, and stimulation of the activating eye starting at 6 sec, respectively.D, PSTH for delayed dichoptic stimulation in reverse order as compared with C. The graphs on theright of the PSTHs show the firing rate changes that can be attributed to the effects of eye dominance (B-A), activating stimulus appearing anew (C-B), and the nonactivating stimulus appearing anew (D-B), respectively. To this end, the PSTHs have been pairwise-subtracted, as indicated in Figure 2. Note that the subtraction is performed only for parts of the respective PSTHs (compare with Fig.2B) and that a smaller scale is used to show the firing rate differences. E–H show the same analysis asA–D but for neurons driven by the nondominant eye. These are the same data as those used in Figure7E–H.