
Fig. 7.
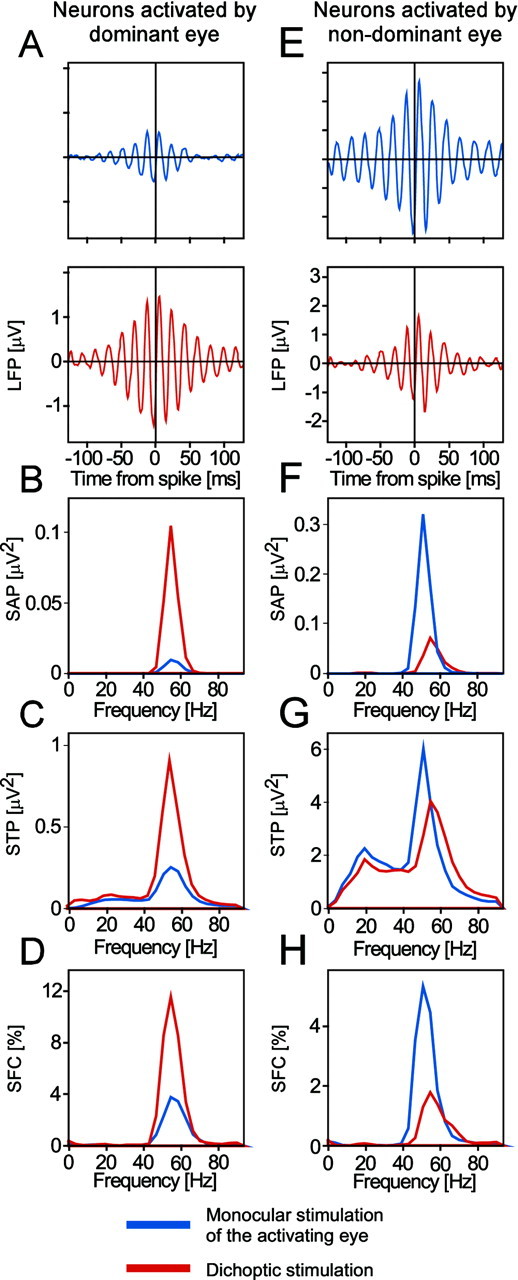
A–D show an example of enhanced oscillatory synchronization caused by eye dominance-dependent stimulus selection. The data in A–D are from neurons driven by the dominant eye. These are the same data as those used in Figures6A–D, 8, and 10. A shows STAs,B the power spectra of these STAs, C the STPs (i.e., the average power spectra of all the LFP segments included in the computation of the respective STA), and D the SFCs (i.e., the power spectra of the STAs normalized by the respective STPs and multiplied by 100). In A–D, the blue graphs show data obtained with monocular stimulation of the dominant eye, and the red graphs show data recorded with dichoptic stimulation. Data are from the third stimulus period, i.e., between 3 and 4.5 sec after stimulus onset (compare with Fig.2A). As shown by all measures, there is a clear increase in oscillatory synchronization with dichoptic stimulation. The fact that this increase is also observed in the normalized SFCs (D) indicates that the increase in power in the STAs (B) cannot fully be explained by changes in raw LFP power (C). Thus, there is a true increase in synchronization between spikes and LFP when stimulation changes from monocular to dichoptic conditions. As the data show, the time-locking of spikes with the field occurs preferentially at frequencies between 40 and 70 Hz. E–H show an example of reduced oscillatory synchronization caused by eye dominance-dependent stimulus suppression. The data in E–H are from neurons driven by the nondominant eye. These are the same data as those used in Figure6E–H.E–H show the same analysis as A–D, with the exception that, inE–H, the blue graphs show data obtained with monocular stimulation of the nondominant eye, and the red graphs show data recorded with dichoptic stimulation.