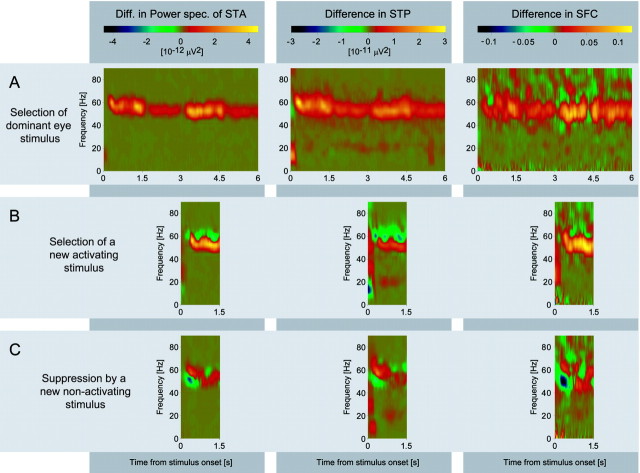
Fig. 8.
The dynamics of synchronization during stimulus selection evaluated with the sliding window technique. The data are from neurons driven by the perceptually dominant eye. These are the same data as those used in Figures 6A–D,7A–D, and 10. All panels show the differences between stimulation conditions as illustrated in Figure 2. The left column shows differences in sliding window power spectra of STAs, the middle column differences in sliding window STPs, and the right column differences in sliding window SFCs. The three rowsA–C display the results of pairwise subtraction according to the procedure illustrated in Figure 2. A, Effect of eye dominance (difference of dichoptic minus monocular stimulation; compare with Fig.2B-A). B, Effect of the selection of a new activating stimulus (difference of the stimulation conditions shown in Fig. 2C-B, i.e., dichoptic stimulus presentation with delay of the activating eye minus dichoptic presentation with simultaneous onset). C, Effect of the suppression of the activating stimulus by a new nonactivating stimulus (difference of the stimulation conditions shown in Fig.2D-B, i.e., dichoptic stimulus presentation with delay of the nonactivating eye minus dichoptic presentation with simultaneous onset). Note that all differences occur in the gamma-frequency band.

