
Fig. 9.
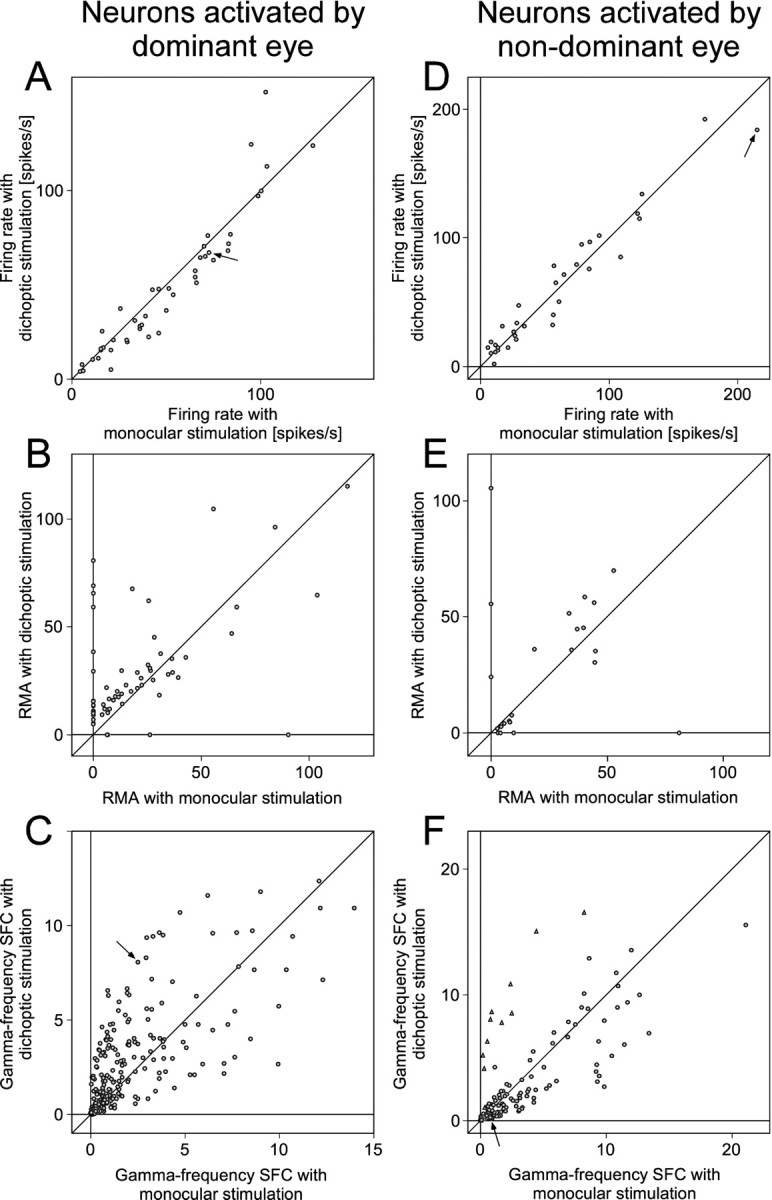
A–C show the statistics of MUA firing rates (A), MUA correlation (B), and gamma-frequency SFC (C) for neurons driven by the dominant eye. In all panels, one dot corresponds to one recording site or a pair of recording sites, and the x value of adot gives the respective parameter under monocular stimulation, whereas the y-axis displays the parameter under dichoptic stimulation. The arrows inA and C correspond to the recordings illustrated as an example in Figures 6, A andB, and 7A–D.D–F show the same analysis as A–C but for neurons driven by the nondominant eye. The triangles in Crepresent identified outliers as described in the main text. Thearrows in D and Fcorrespond to the recordings illustrated as an example in Figures 6,E and F, and 7E–H.