Fig. 2.
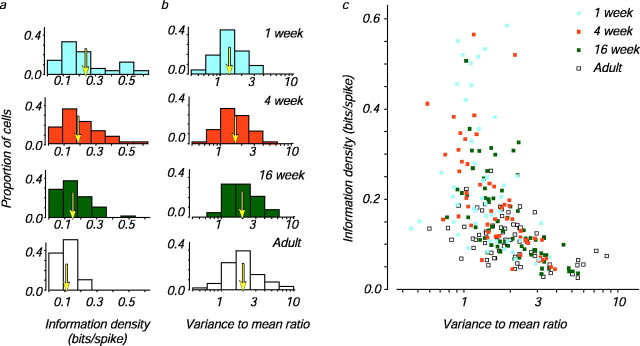
Changes in information density and the variance-to-mean ratio during development. a, Distributions of information density for neurons from monkeys in the four age groups (see Materials and Methods for calculation).Arrows indicate the means. b, Distributions of the variance-to-mean ratio for each age group (see Materials and Methods for calculation). Arrows indicate the geometric means. c, Scatter plot of the data displayed in a and b for 232 neurons from animals in the four age groups: 1 week (47), 4 weeks (53), 16 weeks (66), and adults (66).

