
Fig. 3.
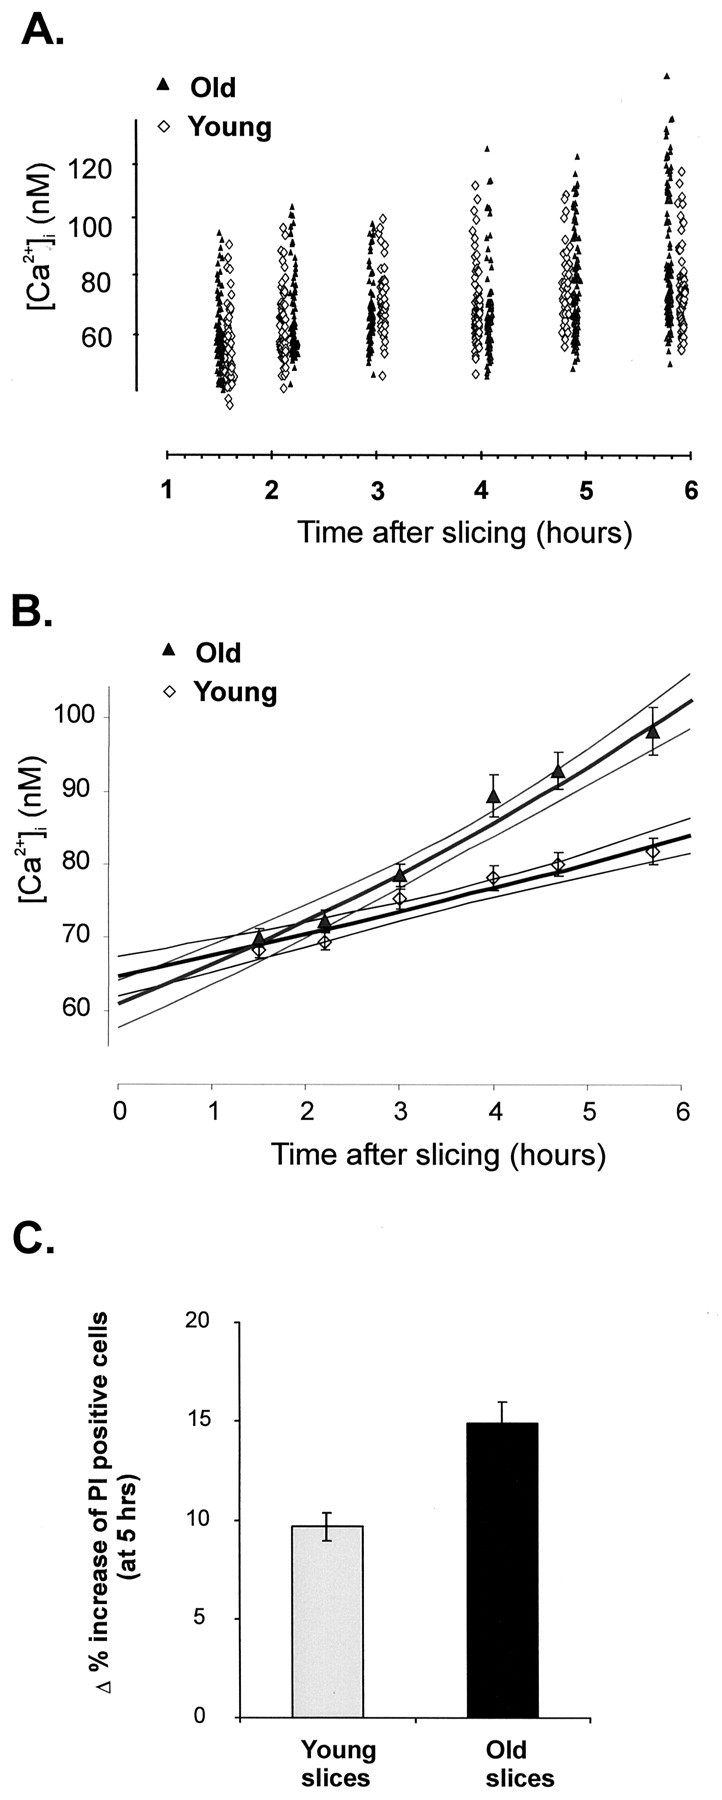
Analysis of resting [Ca2+]i values of cerebellar granule neurons from young (6 weeks) and aged (24 months) slices, maintainedin vitro for extended times. A, Scatterplot of resting [Ca2+]i values of cerebellar granule neurons from young (6 weeks) and aged (24 months) slices, maintained in vitro. After cutting, the slices were maintained in a brain slice holding chamber, in aCSF bubbled with O2 and CO2, for various periods of time. For each age, three separate animals were used; for each time point, a separate slice was loaded with fura-2 AM at the respective time point. The slices were imaged [340 and 380 nm images were taken of several fields (5–7 per slice)] and the resting [Ca2+]i values were calculated offline. B, Graph of the mean ± SEM [Ca2+]i value for each time point and for each experimental group presented in A. The data inA were curve-fitted with various linear and nonlinear models to find the best fit, as described in Results. The graph shows the exponential best fit for each of the data sets (Young and Old), together with the calculated 95% CL, to illustrate the fact that for the first 3 hr the curves are superimposable, after which time the curves become significantly different. C, Increase in neuronal death in slices maintained in vitro for 5 hr. Slices were loaded for 10 min with a PI/Hoe mixture at 1 hr after slice isolation and after 6 hr of in vitro maintenance in the slice-holding chamber (3 young animals, 7 slices at 1 hr and 6 slices at 6 hr; 3 old animals, 5 slices for both 1 and 6 hr). Images of two to three fields per slice were taken, and the number of PI-positive cells (normalized for the total number of cells as labeled by Hoe) was calculated. The graph shows the percentage increase in the number of PI-positive cells over the 5 hr interval of in vitro maintenance.