
Fig. 6.
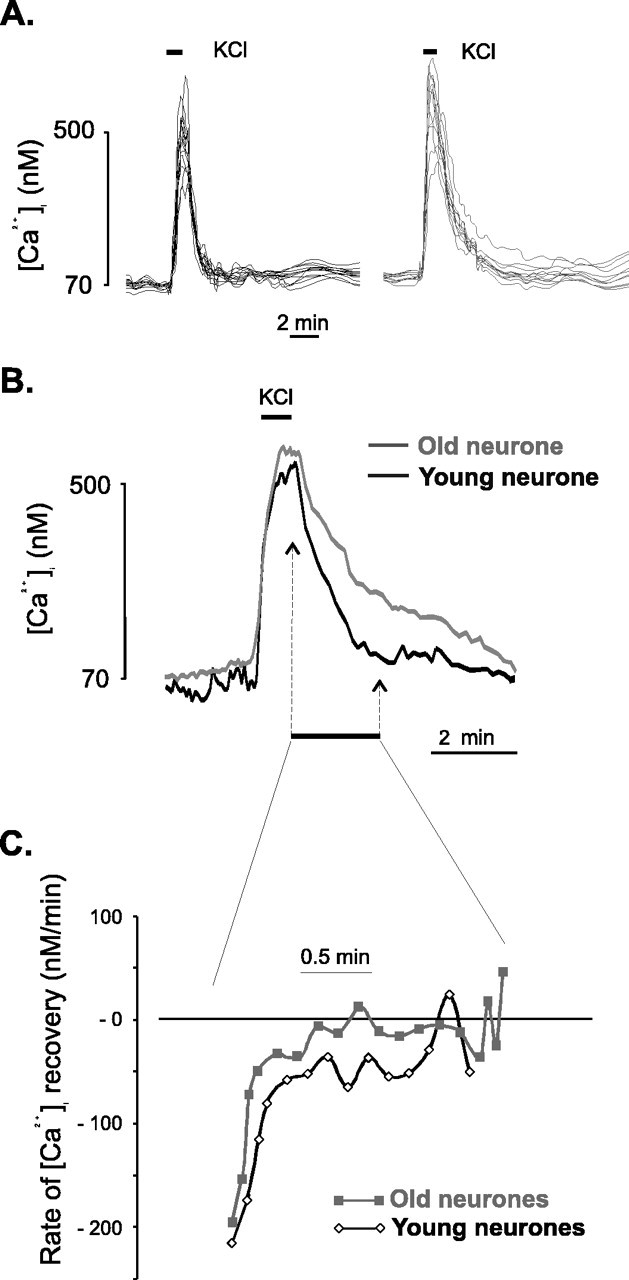
Comparison of [Ca2+]i response to neuronal depolarization in cerebellar granule neurons in slices from young and aged animals. A, Illustration of the range of [Ca2+]i responses to depolarization-evoked stimulation (indicated by the barabove the traces) in a young slice (left) and an old slice (right). For each panel, the traces show data from two separate experiments. B, Superimposition of mean [Ca2+]i traces obtained from cerebellar granule neurons in response to KCl-evoked depolarization in young (black line) and old (gray line) animals. For the aged group, only neurons that showed a monophasic response with full recovery of the resting [Ca2+]i were included for analysis. The traces are aligned for the initiation time point. The traces show the average trace obtained from a representative experiment (7 neurons for the young slices and 5 for the old slices).C, The rate of [Ca2+]irecovery was calculated from the [Ca2+]i values (for the period of time marked in A) as the first-order differential of the Ca2+ trace with respect to time, and is expressed in units of ratio per minute. The first data point displayed on the graph corresponds to the moment at which KCl perfusion was stopped, and the trace covers the period of time highlighted in B. The two-factor ANOVA on the two data sets (young and old) indicated a statistically significant difference between them (p = 0.015).