
Fig. 8.
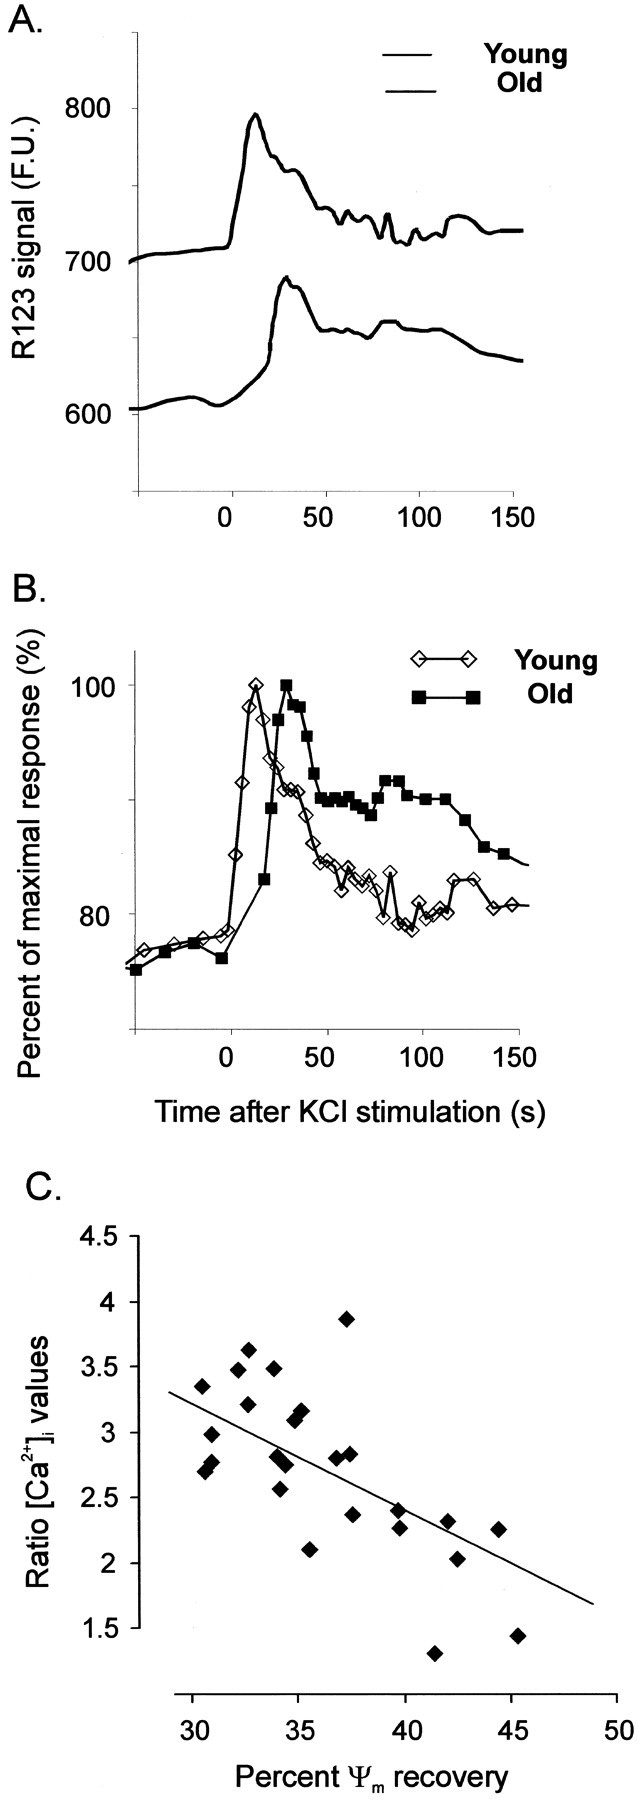
Comparison of the response of rhodamine-123 to neuronal depolarization in cerebellar granule neurons in slices from young and aged animals. A, The average rhodamine-123 (R123) fluorescence traces from one representative experiment (young slices, 7 neurons; old slices, 6 neurons) are plotted, in fluorescence units (F.U.) against time, for the first 150 sec after the initiation of KCl perfusion. B, The same set of data are replotted, normalizing for the maximal rhodamine signal for each group independently. Traces are carefully aligned so that time = 0 corresponds to the start of the KCl perfusion, which lasted 30 sec.C, Correlation between the mitochondrial Ψmito and [Ca2+]irecovery measured at 60 sec after the initiation of neuronal stimulation. For calculation of the Ψmito recovery, the amplitude of the depolarization-evoked mitochondrial response (in fluorescence units) was taken as 100%, and the amount of fluorescence decrease associated with mitochondrial repolarization was expressed as a percentage of this value. For calculation of the [Ca2+]i recovery, the ratio between the [Ca2+]i value at 60 sec and the resting [Ca2+]i was calculated and is expressed on the ordinate. The solid line shows the linear regression best fit for the experimental values.