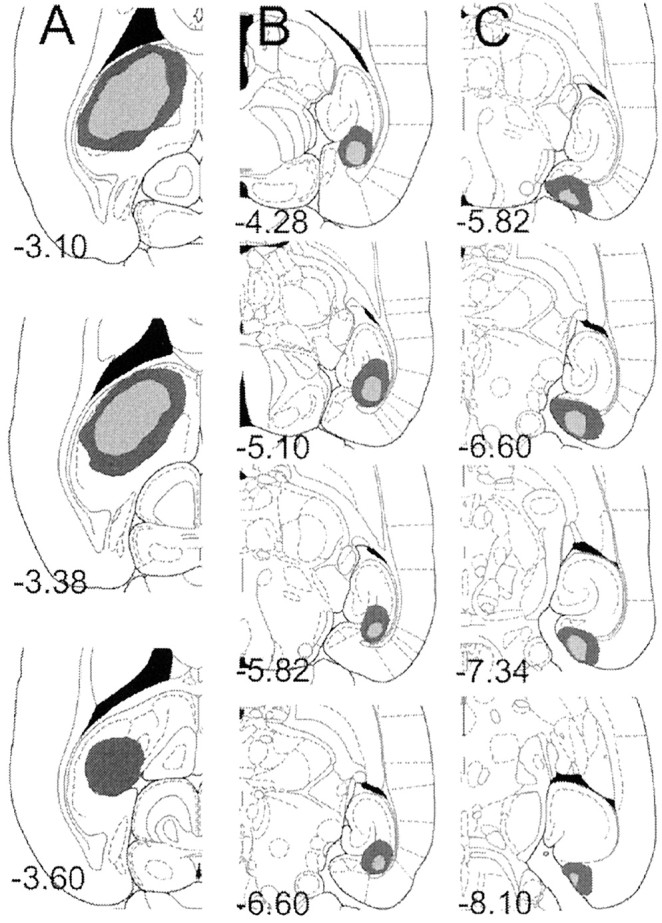
Fig. 2.

Line drawings of horizontal sections from the brains of subjects with the maximum (dark gray) and minimum (light gray) damage resulting from unilateral electrolytic lesions of the dorsal hippocampus (left) and contralateral (middle) NMDA lesions of subiculum or NMDA lesions of entorhinal cortex (right). Each section is marked with its position in the DV plane (millimeters relative to bregma). Drawings are from Paxinos and Watson (1998).
