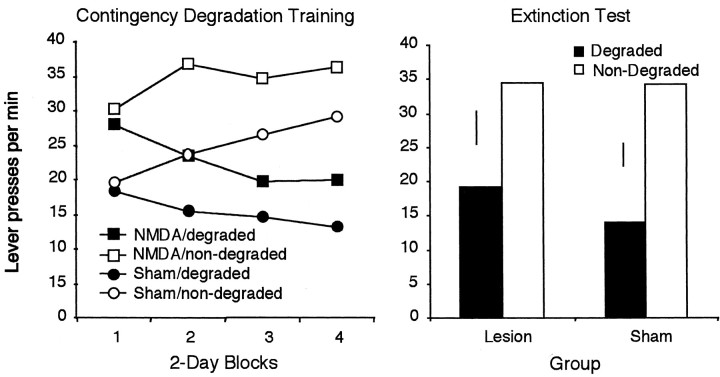
Fig. 4.
Mean lever presses per minute across 2 d blocks of contingency degradation training are depicted atleft. For each group, one action–outcome contingency had been degraded, whereas the other remained nondegraded.Right, Lever responses for NMDA- and sham-lesioned rats in a two-lever choice extinction test. Error bars represent ±1 SED for the within-subjects variable in each group.

