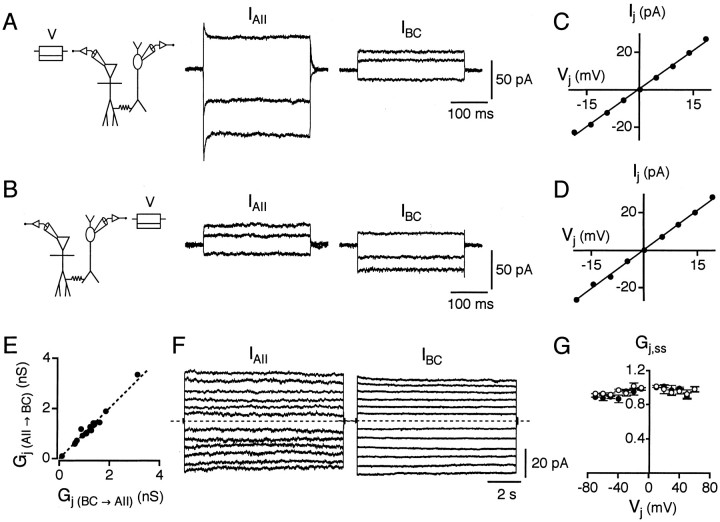
Fig. 2.
Junction conductance of electrical synapses between AII amacrine cells and ON-cone bipolar cells. A, With a cell pair in voltage clamp (Vh = −60 mV), 300 msec voltage pulses (V) of −20, −10, and +15 mV are applied to the AII amacrine cell while current responses are recorded from both cells (IAII andIBC). Hyperpolarizing pulses applied to the AII amacrine cell result in inward currents in this cell and outward currents in the bipolar cell (type 7). A depolarizing pulse in the AII amacrine cell results in an outward current in this cell and an inward current in the bipolar cell. Here and in subsequent figures, the recording configuration is drawn with the AII amacrine cell on theleft and the ON-cone bipolar cell on theright. B, Same as in A, but voltage pulses are applied to the bipolar cell (V). C, Current–voltage relationship for the junctional current (Ij) versus the junctional voltage (Vj) for cell pair inA and B; voltage pulses (from −20 to +20 mV, 5 mV increments) applied to AII amacrine cell (as inA). The data points have been fit with a straight line (slope = Gj). D,Same as in C, but voltage pulses applied to bipolar cell (as in B). E, Comparison ofGj in each direction indicates nonrectifying electrical coupling [Gj (BC→ AII) for bipolar cell presynaptic;Gj (AII→ BC) for AII amacrine cell presynaptic]. The dashed line has a slope of 1 [Gj (BC→AII) = Gj (AII→ BC)]. F, Relaxation experiments to determine steady-state voltage sensitivity of electrical junction conductance between two coupled cells. Experimental paradigm as in A and B, but presynaptic voltage pulses are 10 sec in duration (−60 to +60 mV, 10 mV increments).Traces illustrate postsynaptic current responses (IAII) with voltage pulses applied to the bipolar cell (left, type 8) and postsynaptic current responses (IBC) with voltage pulses applied to the AII amacrine cell (right). Note that for larger amplitude voltage pulses, there is slight decay of postsynaptic currents toward a (non-zero) steady-state level. Dashed lines indicate baseline current. G, Plot of steady-state junctional conductance (Gj,ss) as a function ofVj. Gj,ss at eachVj is plotted as mean ± SEM. Data points are normalized to the instantaneous value at eachVj. Data for each direction of coupling are plotted separately, with either an AII amacrine cell (○) or a bipolar cell (●) postsynaptic.

