
Fig. 6.
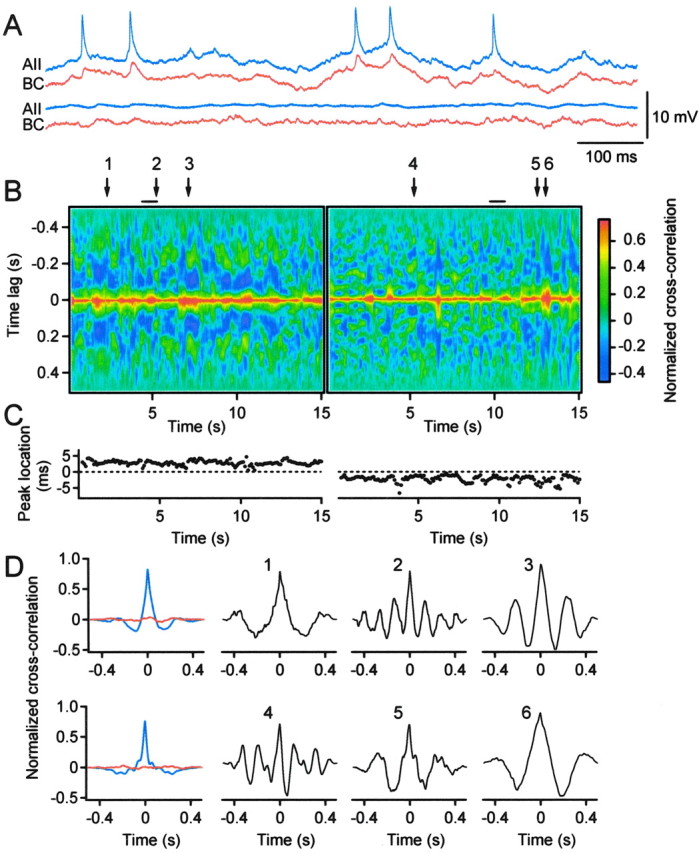
Synchronous subthreshold membrane potential fluctuations during spontaneous activity. A, Spontaneous activity of a pair of simultaneously recorded, electrically coupled cells (AII amacrine cell, blue; cone bipolar cell type 7, red) in control solution (top) and in the presence of antagonists of chemical synaptic transmission, TTX and Co2+ (bottom). B,Sliding 2D cross-correlograms for 15 sec continuous recordings of same cell pair as in A (left, control condition; right, with blockers). Horizontal axis, Time at the center of the 0.5 sec sliding window;vertical axis, time lag from the center (zero time delay) of the window. The normalized correlation amplitude is coded by color (bar, right). Period of recordings in A is indicated by solid horizontal lines. C, Location of peak amplitude in 2D cross-correlograms in B (left, control condition; right, with blockers). D, One-dimensional cross-correlograms (top row, control condition; bottom row, with blockers): time-averaged normal (blue) and shuffled (red) cross-correlograms (left); cross-correlograms centered at time points corresponding to arrows 1,2, and 3 in B (control condition); cross-correlograms centered at time points corresponding toarrows 4, 5, and 6 inB (with blockers).