
Fig. 3.
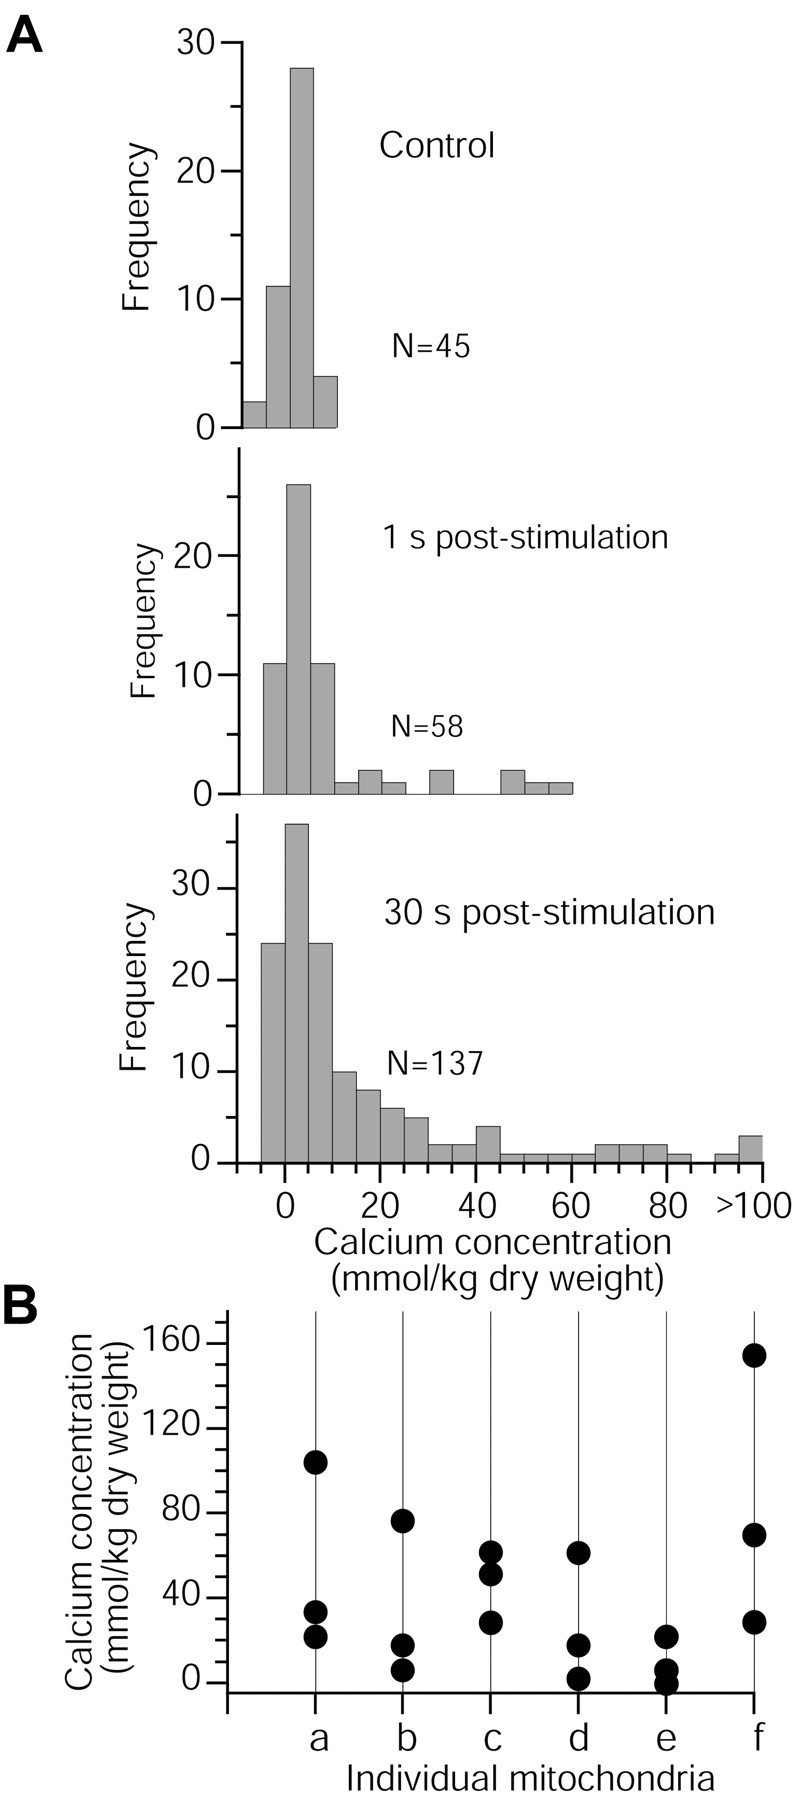
Heterogeneous distribution of [Ca]mito within individual mitochondria after synaptic stimulation. A, Mean [Ca]mito in resting dendrites is low, and the distribution of individual measurements is normal (top panel), as indicated by a good fit (R2 = 0.99) to a single Gaussian with a width (ς = 2.5 mmol/kg dry weight) expected because of statistical uncertainties in EDX analysis. At 1 sec (middle panel) and 30 sec (bottom panel) the distribution becomes progressively skewed toward higher [Ca]mito as a result of a sequestration mechanism that concentrates Ca in small inclusions within the mitochondrial matrix.B, Distribution of single [Ca]mitomeasurements from six representative mitochondria with elevated Ca levels that were analyzed at three separate locations using a 100 nm probe. Large differences in [Ca]mito within each of these mitochondria reflect the heterogeneous distribution of calcium within individual mitochondria.