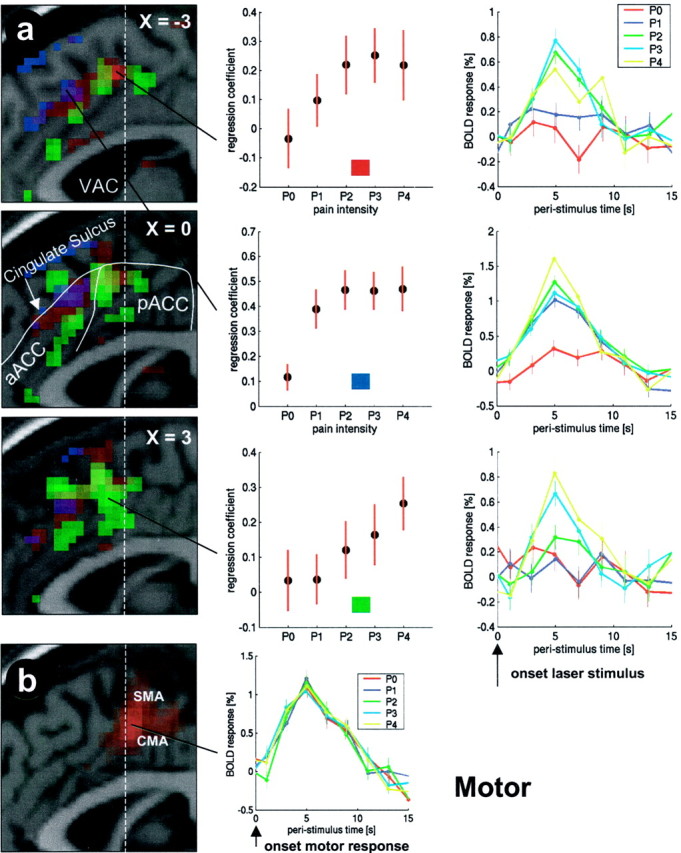
Fig. 3.

Activations in the ACC (p < 0.001) overlaid on a structural T1-weighted MRI used for spatial normalization. Laser-evoked responses and their locations are depicted ina. Three sagittal slices through the ACC are shown from x = −3 mm to x = 3 mm. The dashed white lineindicates the vertical line through the anterior commissure (VAC). Regions showing different SRFs are color-coded. Stimulus intensity-related areas are shown in red, pain intensity-related areas are shown in green, and cognitive processing-related areas are shown in blue. The top row shows an area in the dorsal pACC with a stimulus intensity-related (red) SRF. The middle row shows the cognitive processing-related step function response of a region in the cingulate sulcus of the aACC (blue). The bottom row shows the SRF of a pain intensity-related area in the ventral pACC (green). (Figure legend continues.)(Figure legend continued.) Themiddle column shows the individual SRF for each region. Fitting canonical HRFs (see Materials and Methods for details) to the data yields a regression coefficient indicating the magnitude of the response for each trial type (P0–P4). This magnitude (±SEM) plotted as a function of rating is the SRF. In the right column, adjusted data in each region are plotted in bins of 2 sec as a function of peristimulus time separately for P0–P4. In b, the motor-evoked hemodynamic response in the CMA is plotted. Additional motor-evoked responses were observed in the SMA.
