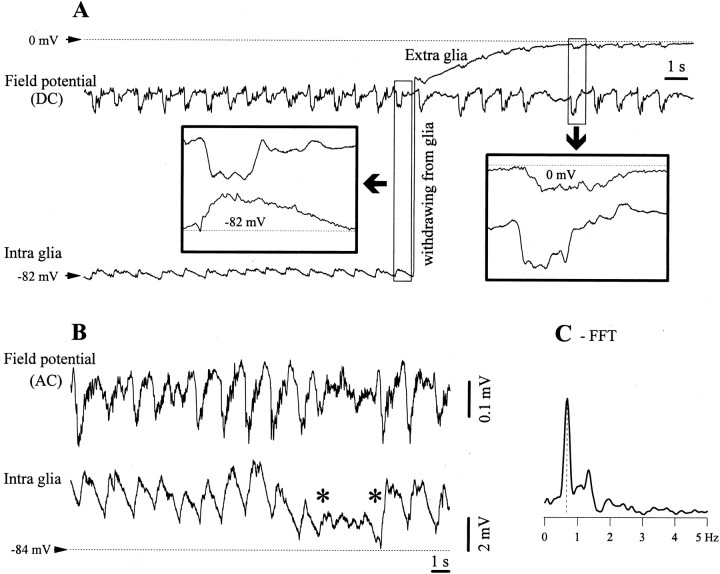
Fig. 1.
Slow oscillation in glial cells. A, Intracellular and DC field potential recording before the withdrawal of the micropipette from the glia. The two epochs within the squares are expanded to show, for a cycle of the slow oscillation, the relationship between intraglial and extracellular field potentials (atleft) and the similarity of the two field potentials recorded by two different electrodes. The membrane potential (Vm) of the intracellular recording and the neutral extracellular potential are indicated.B, Short period of activated EEG (betweenasterisks) interrupting the slow oscillation, as recorded from a glial cell and AC depth field potential. The activation of the EEG is associated with relative hyperpolarization of the glial cell. C, Power spectrum of a 75 sec period containing the one in B. The main oscillatory frequency is ∼0.7 Hz with some additional components in the 0.1–1.5 Hz frequency band.

