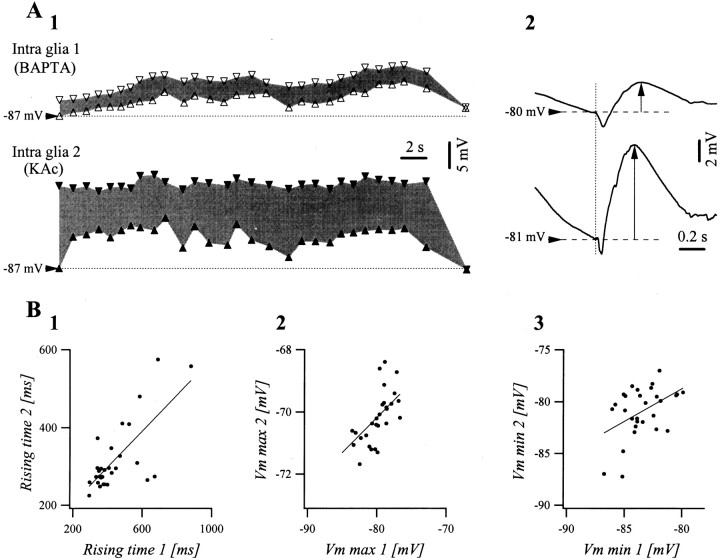
Fig. 10.
Effect of BAPTA (0.1 mm) on the intraglial steady depolarization associated with SW seizures.A1, Envelopes of a SW seizure in a dual intraglial recording at short distance (∼1 mm). The cell 1 was recorded with a pipette containing 0.1 mm BAPTA, and cell2 was recorded with 3 m potassium acetate. The bottom traces (upward triangles) represent the voltages at the onset of the phasic depolarizations, whereas the top traces (downward triangles) correspond to the maximum voltage reached during each SW complex. Thus, the gray surface designates the phasic depolarizations during individual complexes. A2, WTAs of the SW complexes in the two glial cells recorded simultaneously. Both envelopes and phasic events have diminished amplitudes in the recordings with BAPTA. B1, Rising time of individual SW complexes of cell 2 plotted against the same parameter in cell 1 (dots) and the linear fitting (correlation coefficient r = 0.72).B2, Superior envelope in cell 2 against superior envelope in cell 1 (dots) and linear fitting (r = 0.62). B3, Inferior envelope in cell 2 against inferior envelope in cell 1 (dots) and linear fitting (r = 0.45).

