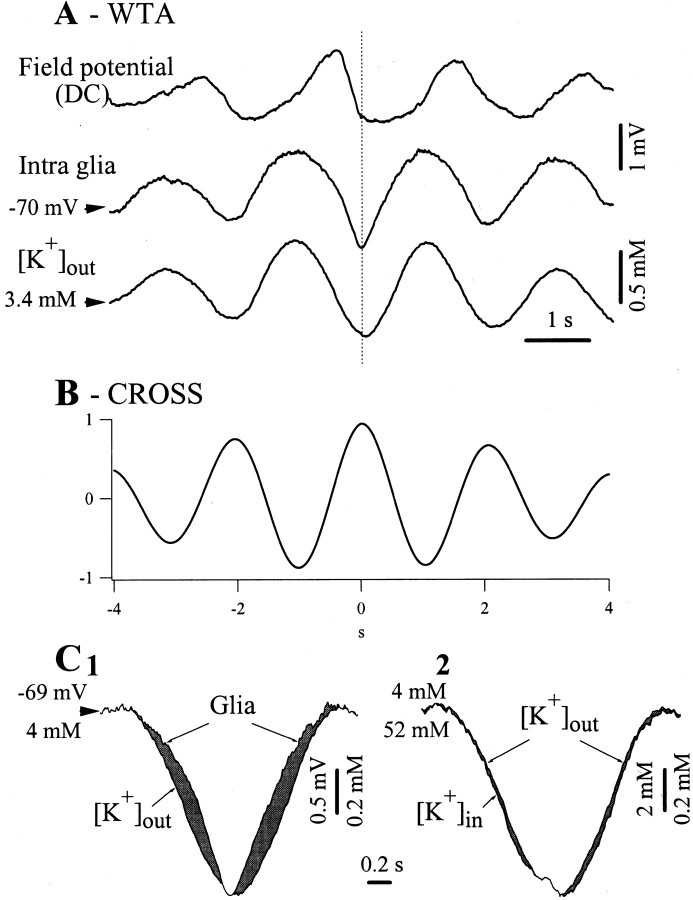
Fig. 3.
Short-range spatial buffering of extracellular K+ during the slow oscillation. Simultaneous recording of a glia, DC field potential, and extracellular K+ concentration ([K+]out). A, WTAs (n = 50) triggered by the onset of the intraglial depolarization show in-phase variations of the [K+]out and glial potentials. The former were obtained after subtracting the DC field potential from the potentials measured with the ion-sensitive microelectrode (see Materials and Methods). B, Cross-correlation between glial and K+ time series performed over a duration of 2 min. The central correlation peak indicates a correlation coefficient of 94%, with a latency of 7 msec (the intraglial potential precedes the K+ concentration). C1, Superimposition of the intraglial and [K+]out WTA signals expanded at the maximum amplitude, to provide a comparison between the dynamic variations of the two signals (the respective starting and calibration values are indicated separately). C2, Superimposition of the extracellular and intracellular K+ concentration WTAs expanded at the maximum amplitude. The latter ([K+]in) was calculated from the Nernst equilibrium potential. Note little dynamic difference with respect to the [K+]out signal.

