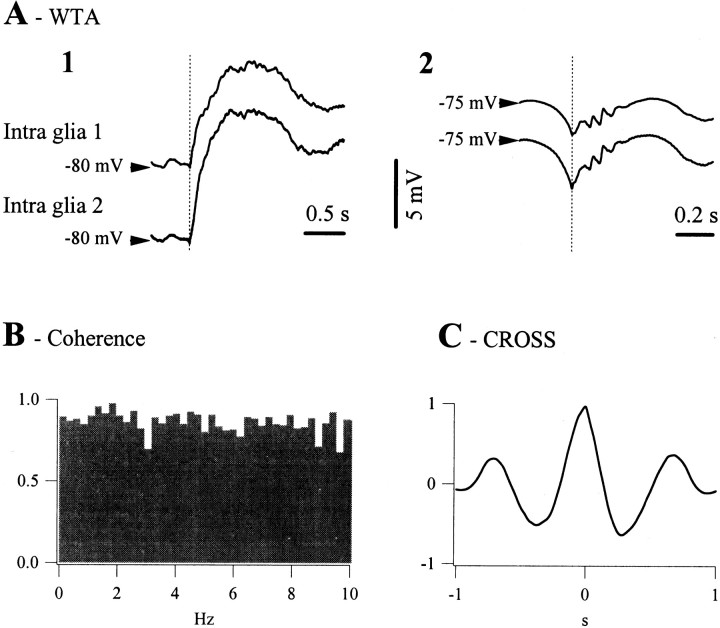
Fig. 5.
Average voltage relationships and synchronization parameters for the glial pair depicted in Figure 4. A1, WTAs from the first paroxysmal discharges in 10 seizures.A2, WTAs from the ictal SW complexes recorded during the same seizures. B, Coherence function between the two glial cells. The highest peak reached 0.98 at a frequency of 1.9 Hz.C, Cross-correlation between the glial potentials (correlation peak of 0.97 at a time lag of 4 msec, the second cell leading the first one).

