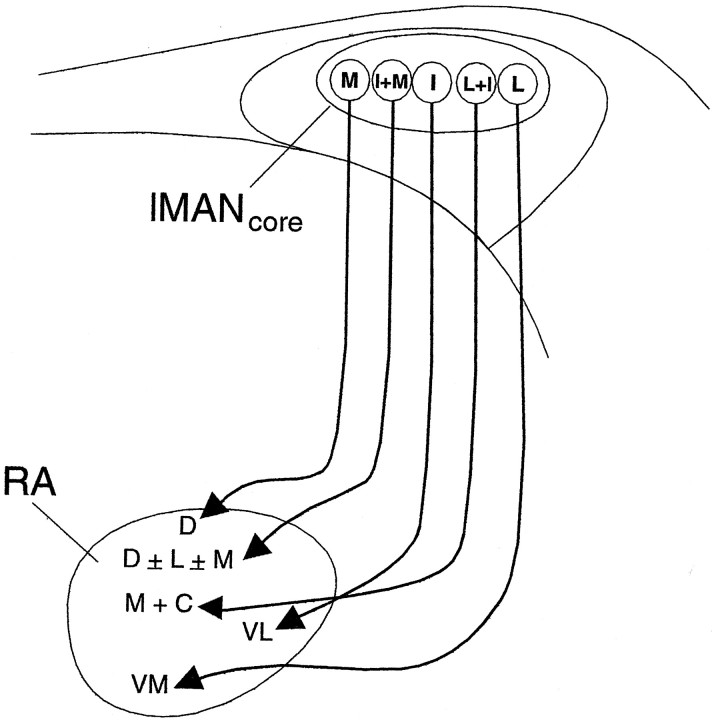
Fig. 2.
Schematic depicting the overall topographic map of the axonal connections of right lMANcore onto RA in a male zebra finch (see Results) (cf. Johnson et al., 1995; Iyengar et al., 1999). D, Dorsal; I, intermediate;L, lateral; M, medial;I+M, intermediate + medial; L+I, lateral + intermediate; M + C, medial + central;VL, ventrolateral; VM, ventromedial;D ± L± M, dorsal ± lateral border ± medial border.

