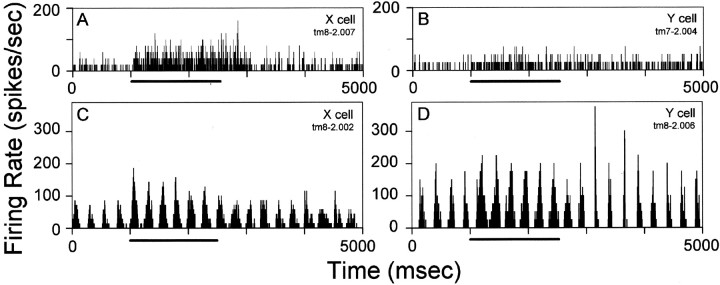
Fig. 2.
Effect of tuberomammillary nucleus activation on spontaneous activity (A, B) and visual responses (C, D) of two representative LGN X-cells (A, C) and Y-cells (B, D). The visual stimulus inC and D, used most often in these experiments, was a sinusoidal grating drifting at 4 Hz. Thebar below each histogram indicates the period of tuberomammillary (tm) stimulation.

