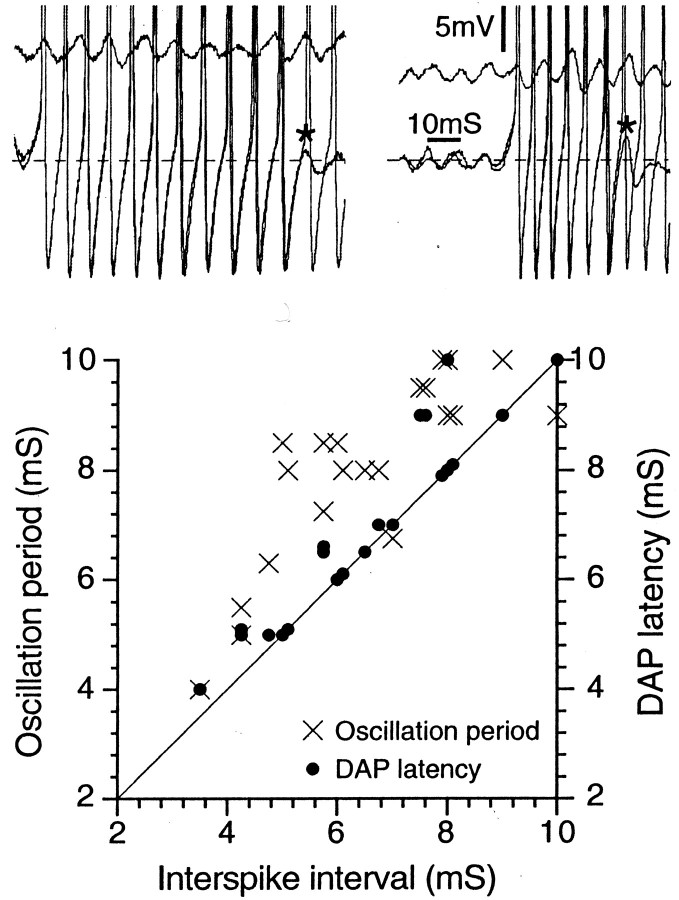
Fig. 3.
The interspike interval within bursts matches the DAP latency, not the oscillation period. The two top panels show spike bursts from two different A0neurons (both at Vr = −45 mV). In each panel, two bursts are superimposed. The shorter of the two bursts ends in a subthreshold DAP (asterisk). The two top panels also show a run of subthreshold oscillations taken from just before the burst, showing that the oscillation period is greater than the ISI. The graph below plots corresponding data for 21 cells.

