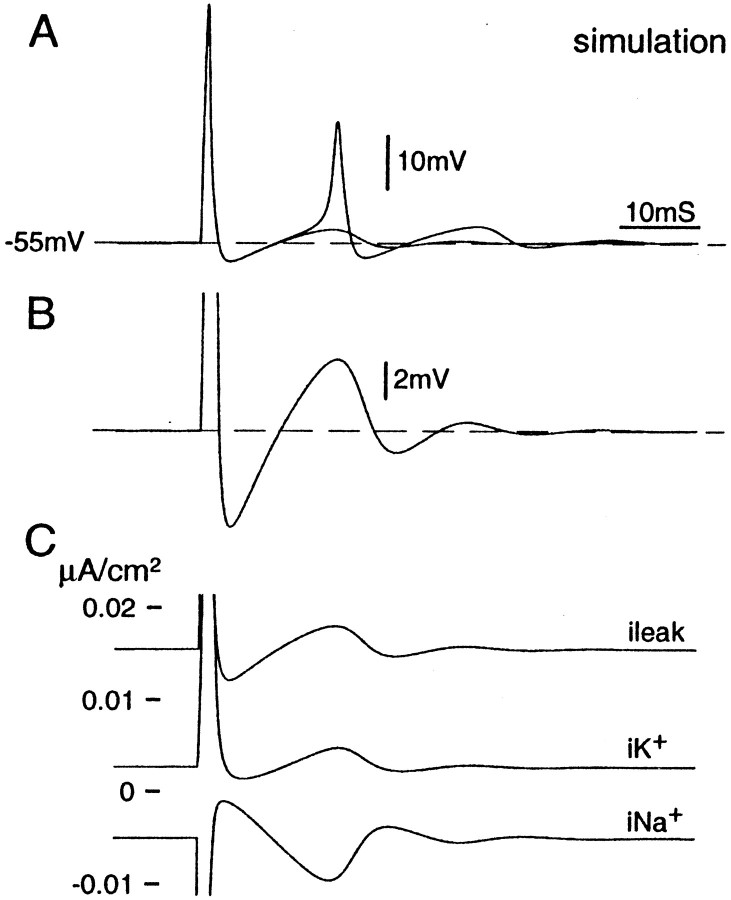
Fig. 7.
Post-spike DAP simulated numerically using the H–H formalism. Cells held at Vr (−77.5 mV) were brought to near −55 mV at t = 0 using a 1 sec depolarizing current step. At t = 500 msec, a suprathreshold depolarizing pulse was given (0.2 msec, 10 nA) to trigger a spike. A, Two superimposed simulations using slightly different current steps. In one (1.030 nA), the post-spike DAP was subthreshold; in the second (1.033 nA), the DAP reached threshold and evoked a second spike. B, Enlargement of thetrace in A with the subthreshold DAP. Note the close resemblance to DAPs recorded from real DRG neurons (Fig.4A). C, Calculated transmembrane leak, Na+, and K+ currents underlying the voltage trace in B.

