
Fig. 2.
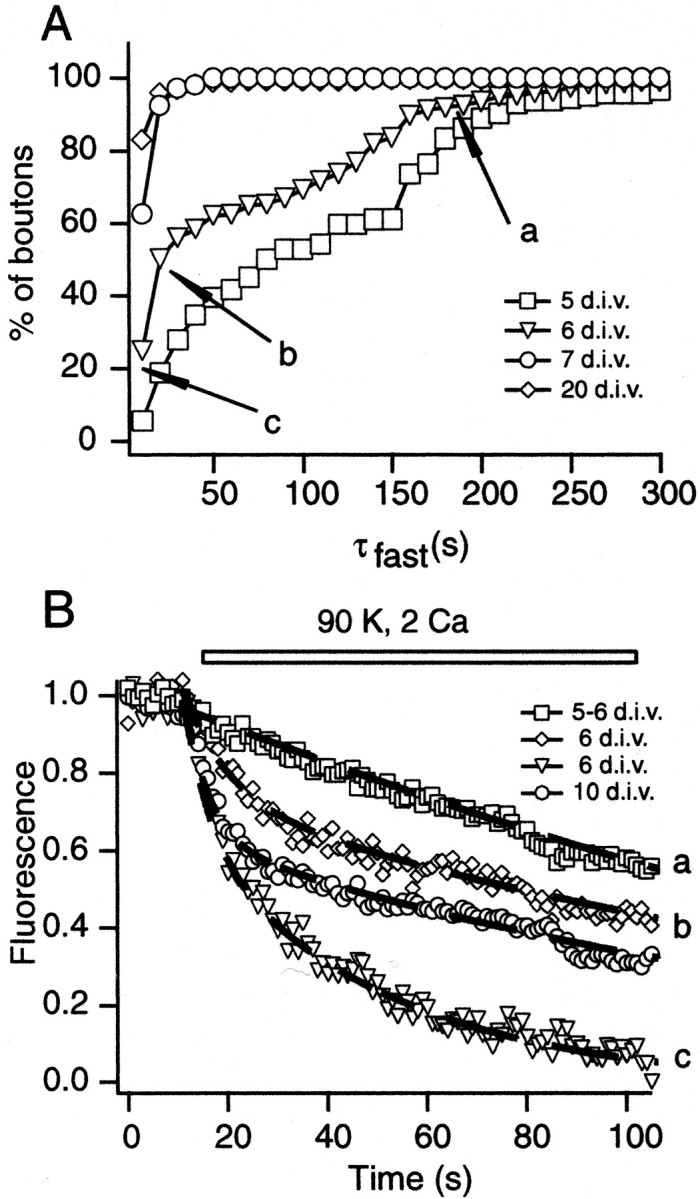
Analysis of FM2-10 destaining kinetics during synapse maturation. A, Cumulative histograms depicting the distribution of the fastest time constants that could be fit to destaining profiles induced by 90 K+stimulation at 5, 6, 7, and 20 DIV. a, b, and c indicate the three distinct populations within the distribution at 6 DIV. Average destaining profile of each population is shown in B. B, Average normalized destaining patterns of synapses from 5, 6, and 10 DIV stimulated with 90 K+/2 Ca2+. Boutons at 5 DIV and some boutons at 6 DIV had a slow destaining profile (a). The remaining boutons at 6 DIV could be classified into two patterns (labeled as b,c) with the use of the histogram shown inA. The dashed lines represent fits to data with two exponential functions.