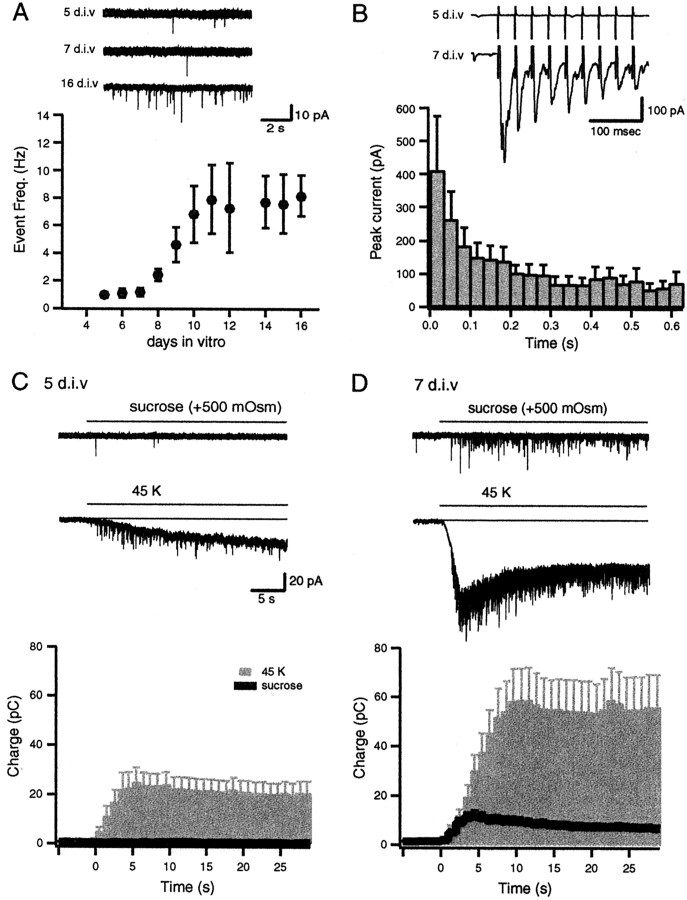
Fig. 3.
Delayed emergence of stimulation-dependent postsynaptic events during maturation. A, Representative recording traces depict spontaneous release events recorded at 5, 7, and 16 DIV. The graph depicts the increase in the frequency of spontaneous events between 5 and 16 DIV (n = 5–15 for each symbol); note the sigmoidal rise in mini-frequency after 8 DIV. B, Traces from two representative experiments at 5 and 7 DIV. In contrast to 7 DIV, the cultures at 5 DIV were not responsive to AP stimulation. The graph depicts the decline in the amplitude of synaptic responses during 30 Hz stimulation at 7 DIV (n = 7). C, D, Comparison of whole-cell recording experiments from cells at 5 DIV (C) and 7 DIV (D). Hypertonic sucrose stimulation was not effective on cells that were tested at 5 DIV, whereas on the same cells 45 K+stimulation induced a substantial increase in event frequency at 5 DIV and to a larger extent at 7 DIV. Baseline current drift induced under 45 K+ perfusion was not sensitive to the subsequent application of blockers of glutamatergic and GABAergic transmission (data not shown) and was omitted from analysis. The bottom panels show cumulative charge transfer integrated over 1 sec bins in response to hypertonic (area under the black line) and hyperkalemic (gray bars) stimulation at 5 DIV (n = 7) and 7 DIV (n = 5). Error bars indicate ± SEM.

