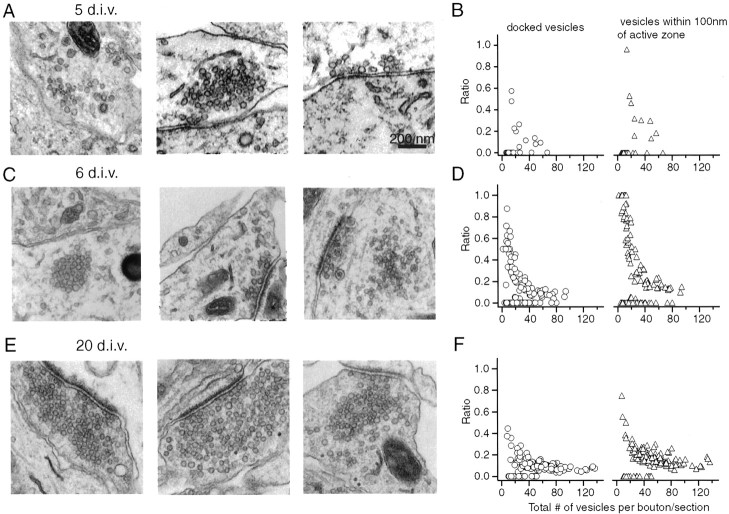
Fig. 8.
Ultrastructural analysis of vesicle organization reveals parallels with functional measurements. A, B, Electron micrographs depicting distinct morphological organization of vesicle clusters at 5 DIV. Of the synaptic vesicle clusters detected at this stage, 74% did not contain docked vesicles (total number of vesicles in a cluster, 14.7 ± 12.5; n = 51), whereas the rest of the synapses had docked vesicles (3.8 ± 1.4;n = 13).C, D, At 6 DIV 40% of the vesicle clusters were not associated clearly with active zones as in 5 DIV (left). In some synapses most of the vesicles were within 100 nm of the active zone (middle). Among synapses with a more mature appearance there was a clear gap (∼200 nm) between vesicle cluster near the membrane surface and a distant reserve vesicle pool (right). D, Left, The ratio of the number of docked vesicles plotted against the total number of vesicles (mean ratio, 0.30 ± 0.20). D, Right, The ratio of vesicles within 100 nm of the active zone to the total in the same boutons (mean ratio, 0.50 ± 0.33). The average values exclude sections without morphologically docked vesicles. E, F, Analysis of synapses in a 20 DIV culture preparation showed an increase in the total number of vesicles per section. Only 12% of vesicle clusters had no distinguishable docked vesicles, and the ratio of the number of docked vesicles versus the total number of vesicles decreased to 0.11 ± 0.07 (for vesicles within 100 nm, 0.19 ± 0.10).

