
Fig. 4.
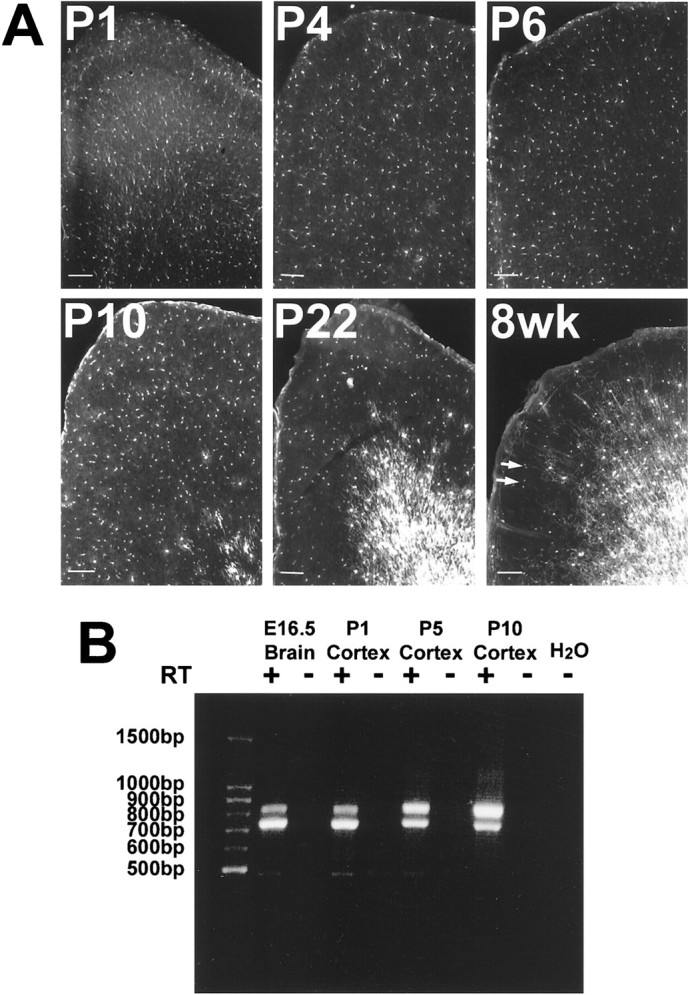
EGFP and plp/DM20 expression in developing cortex. A, Fluorescence imaging of EGFP expression from P1 to 8-week-old animals (EGFP10) in medial frontal sections of cortex (midline is on the left). Intensity of fluorescence increased as the cells became obviously myelinating cells, although cell density did not increase. Arrows in the 8 week sample identify EGFP-positive cells that are also NG2-positive (data not shown). Scale bars, 100 μm. B, PCR analysis of plp (top band) and DM20(bottom band) transcripts in cDNA (+) or reverse transcriptase-negative RNA (−) from cortex dissected from P1–P10 animals (EGFP5). DM20 transcripts are the most abundant in the early ages, including E16.5 whole brain.