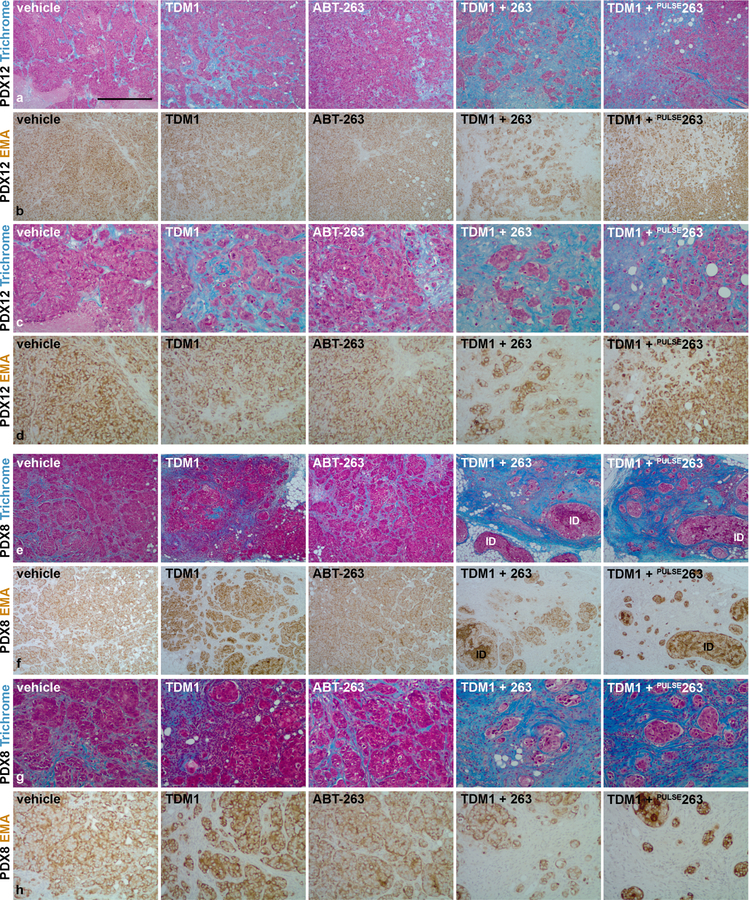
Figure 3.
Tumor cellular and stromal characterization post-treatment. Representative Masson’s trichrome stained tumor sections from PDX12 (a and c) and PDX8 (e and g) comparing vehicle controls, single agents and combination treatment. Masson’s trichrome stains the cell nuclei (black), cell cytoplasm (red) and collagen (blue). Note the emergence of scar-like reactive stroma at the tumor bed in response to combination treatment (c and g). Representative EMA stained tumor sections from PDX12 (b and d) and PDX8 (f and h) comparing treatment groups. Note the substantial elimination of invasive tumor cells in response to combination treatment (d and h). The elimination of invasive tumor cells and the emergence of a desmoplastic stroma are characteristic features of effective treatment response. The images presented in a and b or e and f are magnified in c and d or g and h, respectively. The presence of notable intraductal carcinoma (ID) is indicated. Scale bar, ~525 μm.

