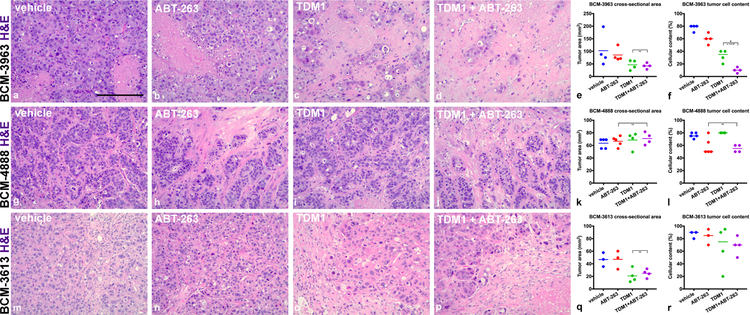
Figure 5.
BCM-3963, BCM-4888 and BCM-3613 response to combination treatment. BCM tumors were administered vehicle controls, single agents or combination treatments for 14 days. ABT-263 was administered continuously days 1–14. Representative H&E images are presented to compare BCM-3963 (a–d), BCM-4888 (g–j) and BCM-3613 (m–p) treatment groups. Note significant elimination of BCM-3963 tumor cells post-combination treatment (d). Tumor cross-sectional area was summarized across multiple tumors from BCM-3963 (e), BCM-4888 (k) and BCM-3613 (q) experiments (Welch’s one-tail t test BCM-3613: vehicle versus T-DM1; p value = 0.0159). Tumor cellular content was summarized across multiple tumors from BCM-3963 (f), BCM-4888 (l) and BCM-3613 (r) experiments (Mann-Whitney one-tail test BCM-3963: vehicle versus T-DM1; p value = 0.0143, T-DM1 versus T-DM1 + ABT-263; p value = 0.0143 and BCM-4888: vehicle versus ABT-263; p value = 0.0357). p values ≤ 0.05 (*) are indicated as numerical values and p values > 0.2 are indicated as NS. Additional statistical tests comparing vehicle with each of the treatment groups are summarized in Supplementary Table 3. Each line represents the mean (e, k and q) or the median (f, l and r). Scale bar, ~185 μm.

