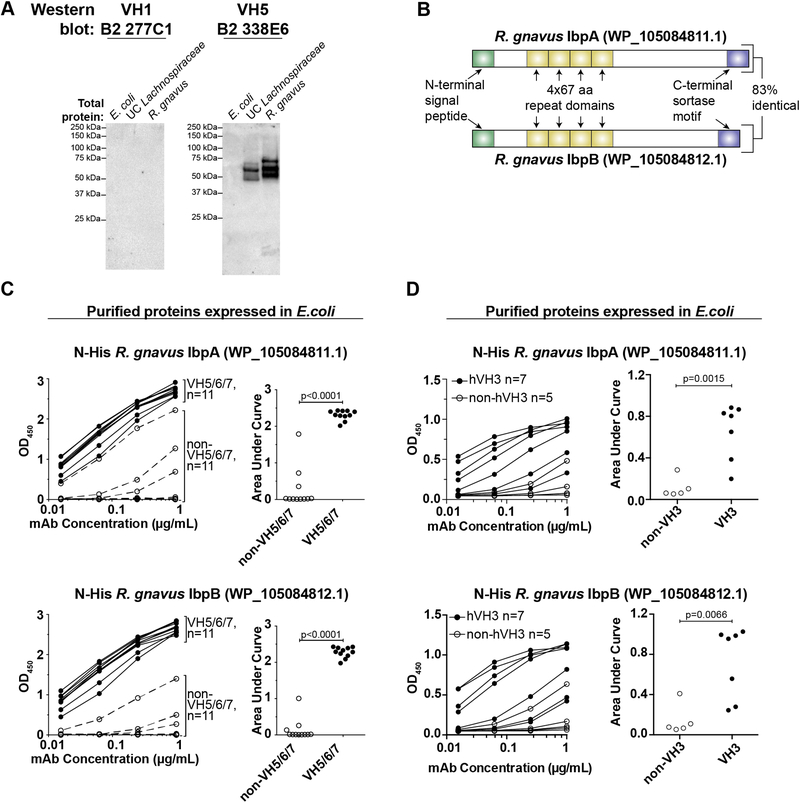
Fig. 2. Identification of the superantigens.
(A) Western blot analysis of total protein lysates from indicated strains probed with non-superantigen-reactive VH1 mAb 277C1 or superantigen-reactive VH5 mAb 338E6. Representative of >3 independent experiments. (B) Diagram of the two superantigens. aa, amino acid. (C) ELISA analysis of purified R. gnavus proteins expressed in E. coli with an N-terminal His tag. Proteins were coated on plates and probed for reactivity against the indicated dose titration of 11 VH5/6/7 or 11 non-VH5/6/7 mAbs from naïve B2 cells, as indicated (left panels) or (D) against 7 human VH3 and 5 non-VH3 antibodies. Right panels summarize the area under the curve for each antibody shown in the left panels. Representative of two independent experiments. P values calculated by unpaired t test.

