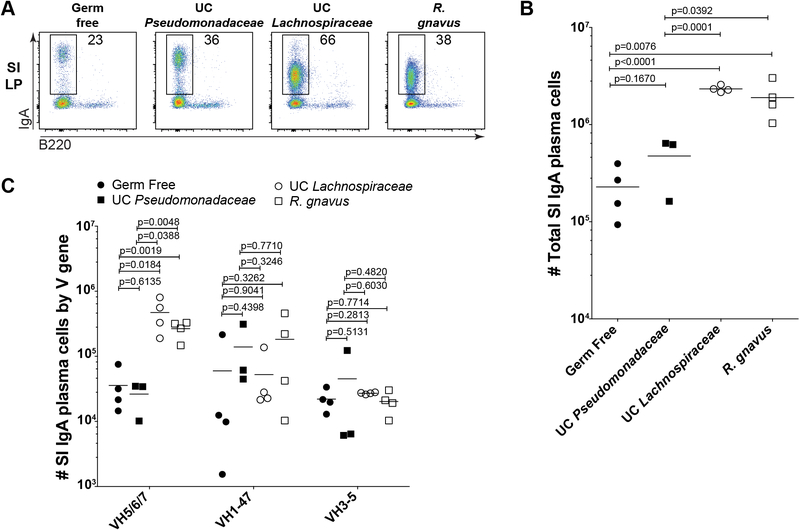
Fig. 4. Superantigen-expressing strains stimulate and attract IgA in vivo.
(A) Representative flow cytometry plots gated on FSChi Lineage- cells or (B) absolute number summaries of SI LP IgA PCs from GF or gnotobiotic mice four weeks after monocolonization with indicated bacterial strains. Data compiled from three independent experiments. (C) Absolute number of SI IgA PCs expressing indicated variable gene families. Calculated from the total cell number shown in panel (B) multiplied by the percent of the repertoire expressing indicated variable region genes as determined by DNA sequencing. One-way ANOVA p values were 0.0048 for VH5/6/7, 0.5156 for VH1–47, and 0.6958 for VH3–5. P values in panels (B-C) calculated by unpaired t test.

