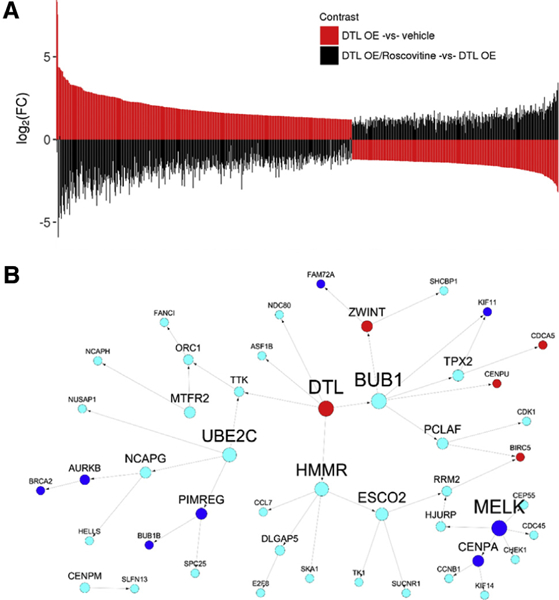
Fig. 6.

Gene expression changes in response to DTL overexpression are reversed by CDK inhibitor roscovitine and are enriched in the DTL centered causal network in AD. (A) CDK inhibitor roscovitine reverses the expression changes induced by DTL OE. The top panel shows the ordered log2 FC of the DTL OE signatures (DTL OE vs. vehicle control). The bottom panel shows the log2 FC between roscovitine-treated cells and DTL OE cells (DTL OE/roscovitine vs. DTL OE) for the DTL OE signatures, which are arranged in the same order as in the top panel. (B) DTL is a key driver in a cell cycle subnetwork in AD. Red and blue colors denote upregulated and downregulated genes induced by DTL OE in HEK293 cells, respectively. Cyan color represents the genes without significant differential expression in the same DTL OE experiment. Abbreviations: FC, fold change; OE, over-expression.
