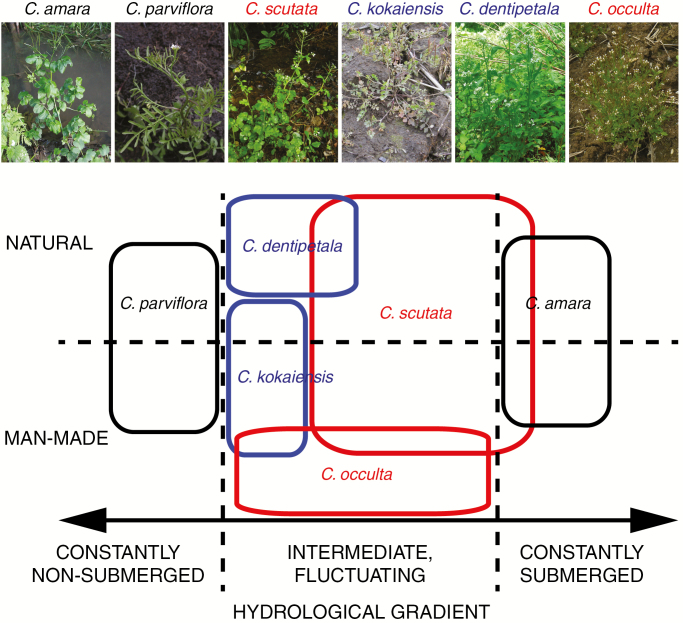
Fig. 4.
Schematic diagram representing niche separation among the six studied Cardamine species along the hydrological gradient (a horizontal arrow separated by vertical broken lines) in natural and human-made habitats (vertically arranged and separated by a horizontal broken line). Black, blue and red rectangles represent habitat ranges of the parental diploids, autopolyploids and allopolyploids, respectively.

