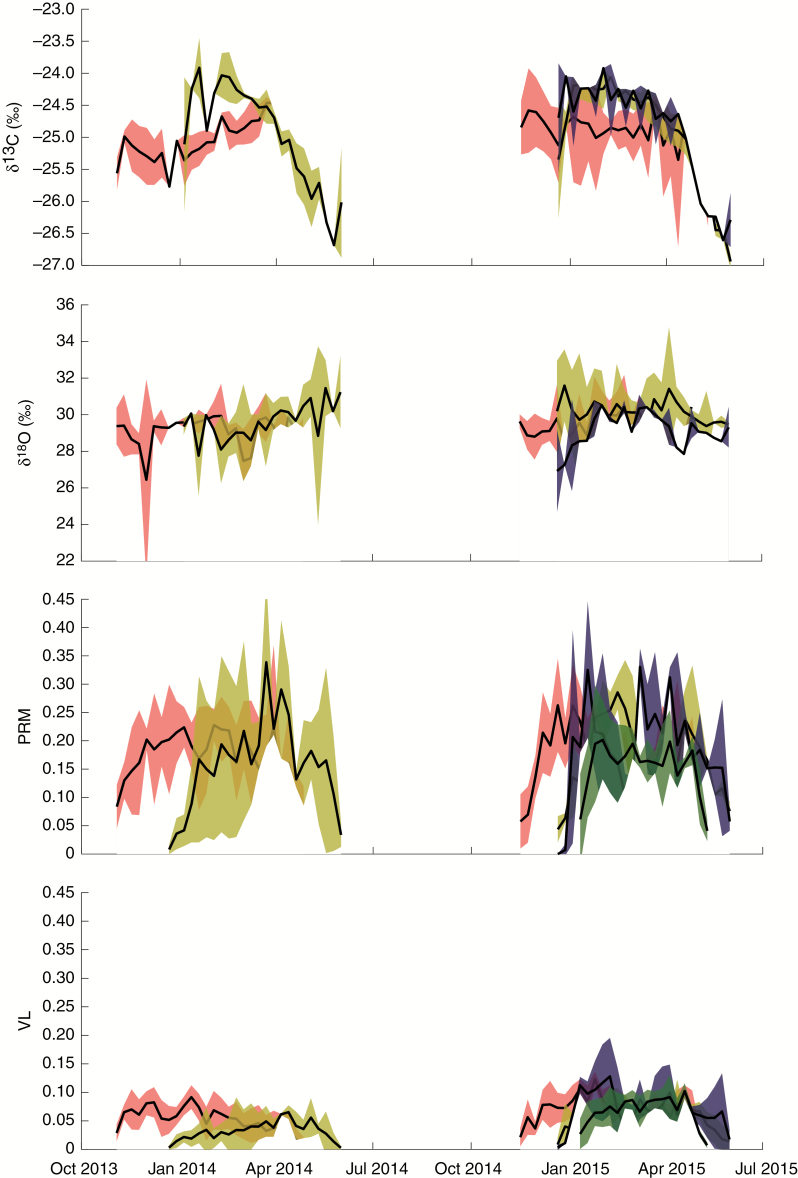
Fig. 2.
Synchronized and averaged trait profiles of four Terminalia superba trees from Central Africa for (A) cellulose stable δ13C pattern, (B) δ18O pattern, (C) parenchyma fraction (PRM) and (D) vessel lumen fraction (VL). Both fractions are unitless. Each colour represents a tree (T1 green, T2 orange, T3 blue and T4 red) and surface plot shows 1 s.e. Gaps represent the dry seasons. T4 starts developing traits first, while T2 and T3 develop traits further towards the end of the season.

