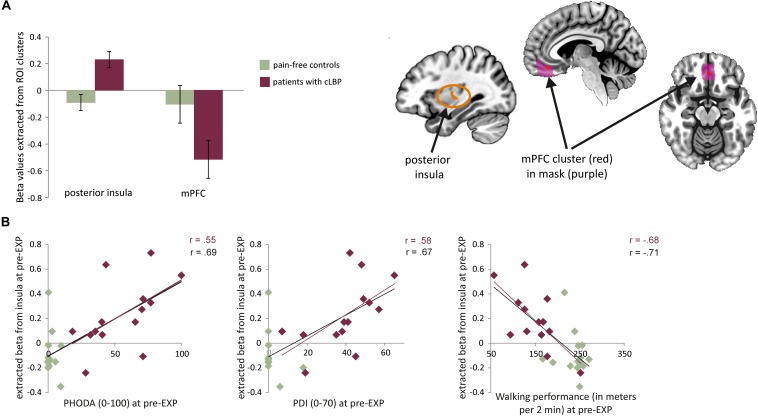
FIGURE 4.
(A) Left: average beta values and standard errors for the MOVEMENT vs. baseline contrast for each group at pre-EXP, extracted from the two areas showing group differences. Right: Depiction of the location of the identified clusters. (B) Correlations between the posterior insula activation (beta value) and pain-related variables (self-reported and performance tasks). Note that the trendlines and magnitude of the correlations are shown for both the whole group (black) as well as the patient group only (red). mPFC, medial prefrontal cortex; PDI, pain disability index.

