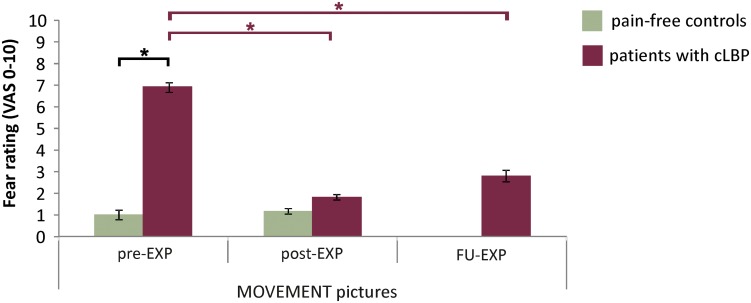
FIGURE 5.
EXP treatment-induced changes in fear ratings. Presented are the means and standard errors for the MOVEMENT pictures for each group across time. Horizontal lines and asterisks indicate significant effects (∗p < 0.05): group effects are shown in black, while simple effects of Session, separate per group are shown in color (red for patients with cLBP; there were no significant Session effects for controls).

