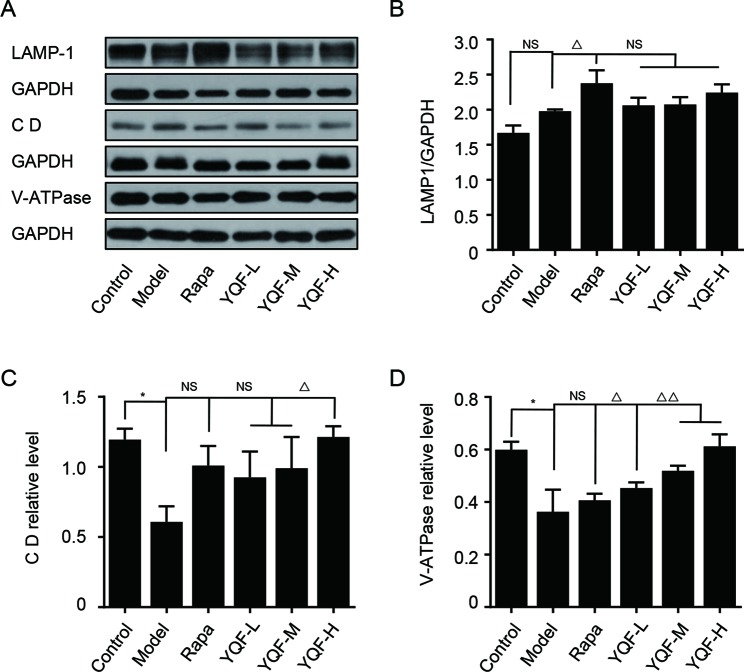
Figure 8.
The expression of LAMP-1, Cathepsin D CD and V-ATPase in HEK293 cells intervened with YQF. (A) Western blot bands, (B) LAMP-1, (C) Cathepsin D, (D) V-ATPase. Data are expressed as mean ± SEM, n = 3, *p < 0.05 compared with the control group, △p < 0.05 and △△p < 0.01 compared with the model group, NS, no significant difference.

